Q & A with Don Anderson
How
do you prepare your forecast?
Once I have gathered all pertinent data from my primary
or favorite sources I scribble the first draft. It consists of:
• The big picture identifying the large systems that dominate the
large and small area weather patterns.
• The direction of any significant changes over the next five or
six days.
• Wind, sea and cloud conditions, analysis and five-day forecast
broken down into approximately 300-mile sections of coastline.
Then I peruse my secondary and usually less reliable sources and fine-tune
my first draft if I believe the data are credible. Then I access as much
recent actual measured data and onsite reports as I can find. These data
come from the Internet as well as from listening to onsite reports to
various maritime and amateur radio nets. Now I return to my draft and
tweak those areas that appear at significant variance with actual onsite
data. I then repeat the whole process two or more times, tweaking as I
go until I feel comfortable with the product. Then I write my final notes
that usually amount to about four pages of scribbled shorthand that can
be read in a period of no longer than fifteen minutes and hopefully less.
This product is for sharing with the various maritime SSB and ham radio
nets where I am invited to give my weather.
How
is it different than a forecast for an individual vessel?
My forecasts for individual vessels on long coastal or
offshore passages are prepared quite differently. These are rather time-consuming
so I can not handle any more than four vessels at a time.
I
start by assessing the performance of the vessel under a variety of conditions.
I then create a file that is actually the vessels track on an electronic
chart. I receive the vessel’s position daily at the same time and
update her track. I compare her 24-hour run with my estimates and tweak
her expected performance accordingly. After each report I project their
expected track out to five days. I then electronically overlay wind and
sea condition forecast charts over their projected track for 12 or 24-hour
intervals. This allows me to bring together two moving targets for the
same points in time. I now have enough information to scribble wind and
sea conditions for each day out to five or sometimes six days into the
future along the vessels projected track. When the vessel next calls me
on any of my radio watch schedules I read her my analysis and forecast.
This process is repeated and the forecast updated each day.
If the vessel fails to report in, or goes missing, I can make a reasonable
estimate of her ETA assuming nothing untoward happened to her. Fortunately,
most of the time this happens it is simply a radio failure.
Describe what that time of preparation is like.How
much coffee drinking time, thinking time, actual hustling does it take
to pull together a forecast?
I awake each morning at 3:30 and spend an hour just thinking
-- recalling and reminding myself about areas of current or imminent significant
weather, vessels with special needs, and those areas where there are large
concentrations of cruisers. By 4:30 I have my thoughts in order, my priorities
set and I’m ready to enjoy another great day.
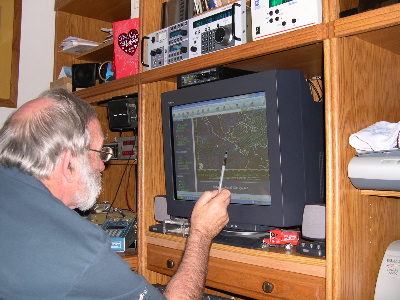
I
turn on the computers in my radio room, look at my small weather station
as well as out the window to see what my local weather is like. Then I
head downstairs to pour a cup of weak coffee purposely left from the previous
day and pop it in the microwave. I pour myself a large glass of orange
juice and then scan the skies while strolling around the back yard, and
then walking out front into the street. This gives me a feel for local
weather and when clear it reminds me where the brightest celestial bodies
are located. That’s useful on those occasions when I receive questions
about the night sky.
Then I head upstairs and start to hustle information. The first search
is for any official warnings from the NWS marine forecast text sites for
those areas I will be covering. Then I make a quick pass at the most recent
satellite images looking for significant weather patterns or systems.
By this time it’s the top of the hour (5 a.m.) and time for that
first real cup of coffee. I turn on all the radios, run downstairs and
take another quick look outside, dump a slug of milk into my coffee and
run back upstairs to begin my radio monitoring of the various nets while
monitoring other frequencies where cruisers call me for specific weather
routing during set time periods. This is the hectic part of the day.
The
next step is to develop a clear credible image of the big picture. That
means identifying the highs, lows, isobar gradients, significant cloud
formations and their temperatures. This allows a preliminary assessment
of the current situation. The next step is to determine how these systems
will change or move over the next five days. This allows a preliminary
forecast to be made in 12 or 24-hour increments.
By
this time I have about four pages of hand written shorthand scribblings.
The next step is to do it all over again but using different sources,
of which there are many dealing with the same areas. Notes citing significant
differences are then inserted in red. Then I do it all over again from
yet more sources and insert difference or additions in a third color.
Now come the judgment calls. I take this mess of scribble and construct
the most probable present picture along with the way things might be in
12 to 24-hour increments out to five or six days. Once I am comfortable
with the big picture I convert it into surface wind and sea conditions
that are the principal interests of the cruisers. I now have about four
pages of reasonably legible notes from which to give myr voice weather.
This big picture is usually in sufficient detail for the long distance
offshore ocean passage makers.
How
did you train yourself to do these forecasts?
I started by listening to the voice marine weather forecasts
from the meteorological organizations in the US, the UK, Canada, Australia
and New Zealand.
Then I devoured all the books I could find on marine weather forecasting.
Then when I felt I knew enough about the science of meteorology and the
meaning of the terms, I started going to the original professional publications
to learn more about specific phenomena such as Tropical Waves, Katabatic
and Anabatic Winds, The Process of Cyclogenesis, El Niño and La
Niña Episodes and Their Effects on Local Weather Patterns, How
to Forecast a Tehuantepecer, The Intertropical Convergence Zone, The Pineapple
Express, an so on and so on.
I have my favorite books and I make it a point to revisit them regularly
to peruse them at random and then pick a few chapters on subjects where
I might be getting a little rusty. Learning is fun and it never stops,
I hope.
Another way to learn is to look very carefully at the written text forecasts
of the professionals. Look for those lines where they refer to their sources
such as NOGAPS, COAMPS, UKMET, MM5 Models, Scatterometer Data, etc. Then
search the web to find them and before you know it you will be accessing
many of the same sources used by the professionals.
All of the NWS offices welcome visitors as well as comments and feedback
via any means. I have learned much by visiting the NWS Forecast Center
on the campus of the University of Hawaii as well as communicating via
letter and e-mail with the staff at the Naval Research Laboratory in Monterey,
California, the Jet Propulsion Laboratory in Pasadena, California and
the National Hurricane Center in Coral Gables, Florida.
How many hours per day do you invest in providing
this service?
3:30
to 9:30 a.m.plus 3:00 p.m. to 6:30 p.m. equals 9 hours.
How much of this is prep time?
The total amount of time spent in radio communication is
about one hour per day. The remainder of the time is spent searching and
scribbling.
I
do a post mortem twice daily on all my forecasts. I take measured and
reported data whenever they become available and compare them with my
forecast for that period. I then try to understand why I got it wrong.
If I understand it, then in future I will tweak or bias the relevant sources
accordingly.
How much is actually talking to cruisers and
nets?
The total amount of time spent in radio communication is about one hour per day. I try to confine my weather to voice communications. It is the most efficient means of communicating with the cruisers and it allows for questions and clarification. Also, it provides me with valuable onsite weather reports that are crucial to assessing the accuracy of the sources I use as well as evaluating my own forecasts.
I try to
discourage requests for weather via e-mail. It’s simply too time-consuming.
Also, the novice cruiser tends to take the written word as official and
gospel and that can lead to problems. If a cruiser really has to receive
their weather via e-mail, I refer them to the many professional weather
routing services.
How did your commitment evolve?
I spent my
first 21 years growing up in a small town in Cheshire close to Liverpool
Bay and the Irish Sea. It’s an area of very rough weather and at
that time was the busiest shipping port in the British Isles. I can’t
remember anyone who did not have a relative, neighbor or friend in some
form of seagoing career.
My great grandfather was skipper of a revenue cutter out of Skibberine
in the 1880’s. My grandfather was a shipwright and made several
voyages around the Horn in a three-masted barque named the “LAPWING”.
There was a large beautifully detailed model in full sail mounted in a
glass case on top of the chest of drawers in my bedroom.
I had two uncles who were radio operators in the British Navy, one in
each of the world wars.
Another uncle was a submariner during world war two and another was chief
purser aboard a Cunard passenger liner.
With this heritage and the stark fact that bad weather was the principal
factor in loss of life at sea, the subject of weather was in our everyday
conversation in our household and in the neighborhood. We learned all
the meteorological terms just by listening to the BBC coastal weather
forecasts. During winter storms, reports of shipwrecks and heroic acts
of lifeboat crews were almost a weekly occurrence. Whenever there was
a vessel in distress in the Mersey estuary, we would hear the boom of
a big gun, called a pontoon, fire off in the neighboring village of Hoylake,
summoning the all-volunteer lifeboat crew to muster at the boathouse.
With all this heady stuff, coupled with my two uncles being radio operators,
as well as another grandfather being an electrical engineer who dabbled
in amateur radio and who taught me how to build my first receivers, it’s
not surprising that my avocation pursuits would be some combination of
sailing, weather and radio communications, or so it seems to have evolved
that way.
As far as
the evolution of a commitment to share weather with others is concerned,
I suppose it just grew out of our involvement in the maritime nets during
our long offshore passages. It seems we had a few more weather gathering
systems aboard “SUMMER PASSAGE” than are found aboard most
cruising vessels. In addition to the usual weather fax stuff, the INMARSAT-C
gave us detailed text forecasts every six hours and a dedicated receiver
automatically printed color encoded infrared and visible pictures from
three of NOAA’s low altitude polar orbiting weather satellites as
each passed overhead twice daily. This allowed us to accurately locate
significant weather systems such as the ITCZ, fronts, troughs, disturbances
and areas of convection in real time as the satellite transited overhead.
Swaths were about 1500 miles wide by about 3000 miles long.
After we returned home in June 2000 I continued my involvement in the
various nets from home and from the boat and it’s continued that
way ever since.
Is your wife supportive?
My wife Joan is an accomplished sailor and navigator and
understands all this stuff I do in connection with weather. We talk about
any significant weather systems and any special or unusual weather needs
of the vessels with which we communicate.
Most of our weather conversations are at meal times. She reads for accuracy and clarity all my weather notes as well as my replies to cruisers’ weather questions.
But it’s
not all radio and weather. We like to have lunch out two or three times
a week and dinner out once or twice a week. We enjoy shopping together
for things for the house and shrubs and trees for the garden.
Joan’s interests are furnishing and decorating the house, cooking,
gardening and crafts. She also takes very good care of our dog and me.
Is the work seasonal, or do you feel like you
have to be there year round?
Because we cover large areas in both the North and South
Pacific there really is no busy or slack season.
November through May the heavy traffic is with vessels between San Diego
and Panama.
Mid March through April we are busy with the Puddle Jumpers heading for
French Polynesia.
May 15 through the end of November has intensely focused periods when
we try to develop as much advance warning as possible for the cruisers
waiting out the East Pacific hurricane season in and around the Sea of
Cortez.
June through October is a busy time doing offshore routing for vessels
heading to and from Hawaii, and vessels on passages from Mexico to the
Pacific Northwest and Alaska.
What's it like for you when a tropical storm
or hurricane or other extreme weather is forming?
I get jittery and nervous and try not to show it but sometimes it comes
through in the sound of my voice.
In
the Eastern Pacific, between May 15 and November 30, on average, we have
17 tropical storms and about seven of them intensify to full blown hurricanes.
Once a tropical disturbance is upgraded to a tropical depression I track it religiously every six hours. That means getting up during the night for a brief peek at my favorite sites. It is the only time I print and file the six-hourly computer model forecasts.
There are
about six different tropic cyclone computer-forecasting models in institutions
around the world. All show reasonable agreement in their short-term forecasts,
but when one looks out about five days, which is far more important than
the short-term picture, one usually finds large disagreement.
I then take a quick look at the most recent infrared encoded satellite
images and actual satellite measured surface winds data. That allows me
to obtain a pretty accurate fix on the location of the center of the cyclone.
I place this real location on the computer model graphic forecasts along
with some scribbled notes. Now I can see which model is proving to be
consistently the closest to the actual track of the cyclone. My forecast
for the next few days then favors that one.
Most East Pacific tropical cyclones systems travel along their tracks
at about 10 knots. When this occurs, the forecasts are reasonably accurate.
Towards the second half of hurricane season, the forward movement of a
few of the cyclones decreases and sometimes even becomes stationary. This
occurs only as long as the cyclone is in the open ocean.
When this happens I get really nervous. There are several reasons for becoming more concerned. Firstly, when the rate of forward movement decreases, the accuracy of all the computer models falls off significantly.
Secondly, after the tropical cyclone slows or stops, it usually takes off in a completely different direction and sometimes gathers speed up to 20 knots along its new track.
Thirdly,
that new direction is likely to be up the Baja California peninsular or
back towards mainland Mexico, areas where many vessels are waiting out
the hurricane season. When a tropical cyclone doubles back on itself,
it is said to be undergoing recurvature.
Most East Pacific tropical storms are born or generated in the open ocean
a few hundred miles offshore Acapulco. During the first half of the season
most of them track towards Hawaii and dissipate at about the halfway point.
Exceptions occur during a strong El Niño episode when they can
travel across and well beyond the Hawaiian Islands.
An example is hurricane Iniki that caused considerable damage to Kauai
in September 1992.
Every year it seems we have at least one hurricane that causes significant
damage to vessels or property or both in the Sea of Cortez or along the
Mexican Mainland. Examples are:
• Juliette that caused serious damage to at least 20 vessels in
La Paz, September 2001.
• Kenna that destroyed a large portion of San Blas and flooded the
waterfront of Puerto Vallarta, October 2002. This was a classic example
of a recursive tropical cyclone. It gathered forward speed greater than
20 knots while packing winds in excess of 140 miles per hour as it made
landfall.
• In 2003, we saw three hurricanes move up into the Sea of Cortez,
Ignacio in August, Marty in September and Nora in October. Ignacio caused
considerable damage mostly from heavy flooding, while Marty wreaked more
havoc than anyone can remember among the cruising fleet throughout the
entire Sea of Cortez, with La Paz, Puerto Escondido, Bahia Conception
and even Puerto Refugio in the far north receiving the brunt of the winds
that peaked at 130 knots. Several vessels at anchor dragged, grounded
and sank, while most of the damage in La Paz was caused by very large
swells that destroyed one of the marinas.
Many cruisers speak highly of their favorite hurricane holes in the Sea
of Cortez, but the historical record shows that only Puerto Vallarta has
escaped all hurricanes. However, nowhere is immune from the large sea
surge that is always a significant part of tropical cyclones.
Is weather forecasting easier because there
is so much more available information or is it more demanding?
Sixty years ago when I first started sailing in England,
all we had were coastal fisheries forecasts broadcast by the BBC on AM
radio. All we could do to augment that was study the sky, the mood of
the sea and the behaviour of seabirds.
Then when I finished college in 1956 I began serving as navigator in offshore ocean sailboat races. Usually the navigator plays the dual role of navigation and weather forecasting. In those early days before LORAN, SATNAV, GPS, SSB and HF e-mail, the navigator spent the first few minutes of his watch scanning the heavens, horizon and sea state and that was all he could do to develop a one-line forecast. The rest of his watch, when visibility allowed, he spent taking altitudes of celestial bodies or ideally a round of three sights and reducing them to lines of position hoping they would cross to form not too large a triangle.
With the advent of electronic navigation aids and the proliferation of weather sources such as USCG voice and WEFAX transmissions, direct reading NOAA weather satellite receivers, INMARSAT-C, HF e-mail, Sat phones, etc., etc., the navigator’s time allocation has done a complete flip-flop. Now he spends a few minutes each watch checking the track trace on the electronic chart plotter and the rest of the time pouring over as much weather data as he can put his hands on.
If all the
coastal and offshore weather forecasts were accurate and agreed with each
other, then we could dispense with the navigator or put him to work trimming,
steering or cooking. But weather is a very complex and chaotic process
and as such, it is unlikely that we will ever see the day when all the
computer models agree. Therefore, the more data we have, the more time
we spend sifting through it in order fine tune the most probable forecast,
point the boat in the right direction and gain that extra few seconds
per mile that will make all the difference in today’s very tight
competition.
The same is true for the land based forecaster, whether amateur or professional;
the more data one has available, the more time one may spend developing
the most accurate forecast. Since none of us has unlimited time, the only
thing that really changes is the fact that the quality of the forecasts
will continue to improve as we develop and gain access to tools of ever
increasing sophistication.
I believe the greatest advances in offshore forecasting techniques in recent years may be attributed to the data obtained from the SeaWinds Scatterometer aboard NOAA’s QuikSCAT Satellite lunched in June 1999. Since that time, this remarkable radar backscatter sensing instrument has allowed the twice-daily generation of charts of surprisingly accurate surface wind vectors for all the large bodies of water throughout the world. It is these measured data that contribute much to the fine-tuning of the general circulation computer models that are responsible for most of the offshore forecasting.
Why do you contribute so much of your time to providing this service?
Well, I don’t really know. It just evolved as a very pleasant and rewarding experience.
I am a scientist by nature and profession, with a passion for learning, understanding and then inventing stuff that might be useful to someone.
I spent
my entire professional career of 37 years in the research departments
of a major oil company, inventing fuel and lubricant additives and later
new techniques for getting more oil out of the ground.
I retired at 62 so Joan and I could do more long distance ocean passage
making.
It turns out that weather forecasting is very similar to a research project.
First comes
the learning and studying, then comes the understanding and finally comes
the invention. While the end product in forecasting is not a patent, it
does share with the patent the fact that it is a piece of paper whose
contents are unique, just as the claims of a patent must be. No two forecasts
are ever identical.
Although the practices of research and forecasting have many similarities,
the end products differ significantly in their intended use. In the case
of the patent one hopes it will lead to a successful commercial enterprise,
while in the case of the forecast one hopes it will contribute to safer
and faster passages.
While I have never really thought about forecasting in this way, you got
me to thinking by asking the question. It seems to me I never really retired,
I just kept doing what I enjoy most, learning something new every day,
trying to understand it, sifting through a whole host of apparently unrelated
data, making some sense out of it and finally creating something new that
might be useful to someone. The process itself can be exhilarating, but
if the product is useful, then therein lays the satisfaction.
Don
Anderson
The sailor and the forecaster
Boating along
the California coast has its inherent risks –– big winds and
weather rolling down the coast from Alaska, building seas and challenging
conditions. But planning a passage using weather forecasts is a simple
radio frequency away. Almost every boat, regardless of size, is equipped
with a VHF radio that can pick up automated weather reports provided by
the National Oceanic and Atmospheric metereologists.
But once a boat leaves for Mexico or beyond, they’re on their own.
One problem is the lack of weather buoys anywhere south of San Diego,
leaving boaters to scramble for information elsewhere.
Anderson, a native of England, understands this. He comes from a long
line of seafaring professionals where weather was always a life or death
issue. His grandfather was a shipwright and his great grandfather was
a skipper of a revenue cutter out of County Cork.
Anderson said that the weather in the British Isles is some of the most
changeable in the world.
“Weather was always the first topic of polite conversation, even
between complete strangers,” Anderson said.
Don first built and raced models of sailboats while in grade school, graduating
to racing one-design sailboats in high school and college.
While studying chemistry in graduate school at the University of Illinois,
he built a Snipe class sloop out of cedar planks, in his free time.
By 1960, he was living and working in San Francisco Bay, where he built
and raced an 18’ Mercury class sloop. Ten years later he bought
his first offshore sailboat, the Lapworth-designed 32’ Dasher “Scotch
Mist.” He sailed and raced Scotch Mist out of Balboa Yacht Club
for the next 20 years, after a job transfer to Southern California.
In 1992, Don and his wife Joan purchased the Valiant 47’, Summer
Passage. They spent the next four years outfitting her for a globe-circling
cruise, while also taking many shakedown cruises to San Francisco Bay,
south to the Sea of Cortez and Acapulco, and several trips to Guadalupe
Island.
By 1998, Don and Joan sailed to Hawaii from Newport Beach, leaving the
next year for a 30,000 cruise through the South Pacific and South America.
They returned to Newport in 2000 by way of the Galpagos and Mexico.
During the South Pacific cruise, Don began to share his weather research
with fellow cruisers during the scheduled marine Single Side Band nets,
which doesn’t require a ham license to communicate. Summer Passage
was equipped with a weatherfax, as well as receivers for automated maritime
weather forecasts and weather images from NOAA weather satellites.
By the time Don was back in the states, word had spread that he was willing
to continue to share his analyses and forecasts with friends still cruising
in the South Pacific. It soon grew to over 150 requests by cruisers.
He finally shifted to providing weather to marine nets through HF ham
radios, and a few individual long-distance offshore passagemakers.
By 2002, Don and Joan moved to Oxnard, specifically to buy a home that
would allow him to build a 75’ antenna tower in his back yard. He
now has a custom Yagi antenna that allows him to broadcast worldwide.
Don understands the perils of weather firsthand. He sailed the annual
Memorial Weekend Corinthian YC race with 72 knots steady on the nose,
off Point Reyes, California. He was one of two boats to finish the course
that year.
The longest period of rough weather he's experienced was a 15-day passage
from Waikiki, Oahu to Nuku Hiva, Marquesas, hard on the wind in 25 to
35 knots all the way, finally hoving to twice to get some sleep.
He also hove to for 48 hours about 50 miles off Chile with the helm lashed
to leeward and roaring seas sweeping the boat. The only thing left on
the deck afterwards was the liferaft.
The most dramatic weather he's experienced was a violent squall near Pitcairn
Island that backed the main and broke the boom into two pieces while shredding
the mainsail. They sailed the remaining 3,000 miles to Chile under a storm
trysail.
And the biggest wave was a 35-foot wave in a flat calm sea while powering
home after returning from Half Moon Bay to Newport Beach. They rolled
90 degrees and put the spreaders in the water. A 36-foot sloop astern
fell off the wave into the trough and smashed the entire coach roof. The
United States Coast Guard rescued the crew and towed the sloop into San
Francisco Bay.
