| Sacramento Forecast Project | State of California Economic Forecast | California State University, Sacramento |
| Revised: Janaury, 2009 | ||
| Unemployment | Fountain Predictor | Taxable Sales | Inflation | Data Tables | Resources | SFP Page | ||
| Employment |
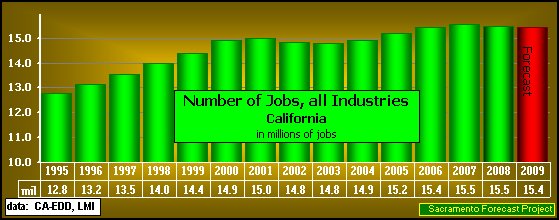
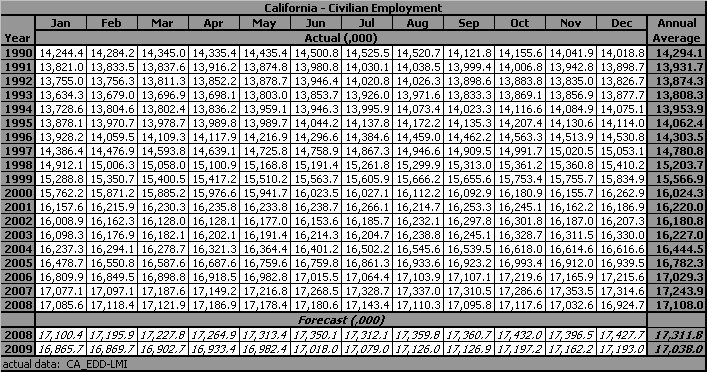
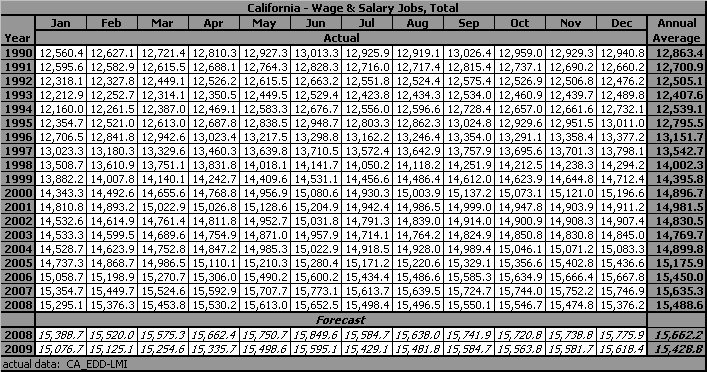
| 31Jan09: The average number of jobs "Establishment Survey" in California declined slightly in 2008, by -0.4%. This follows the weak growth in 2007 of 0.7%. The forecast for 2009, based on actual data through December, is for a similar decline of 0.4% for the year. |
|

| Unemployment |
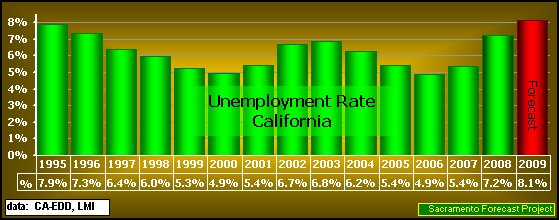
| 31Jan09: The average annual Unemployment Rate for 2008 was 7.2%, up from the 5.4% rate in 2007. The annual rate forecast for 2009, based on actual data through December, 2008, is a higher 8.1%. |
|
| Fountain Predictor |
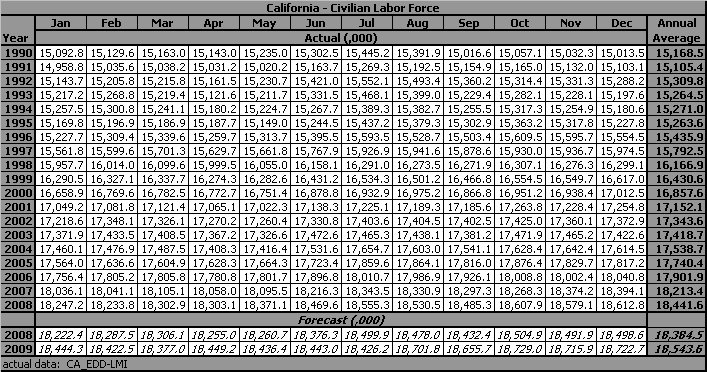
| 31Jan09: The predictor has been negative for the last 22 months with the pattern getting more negative each month and mirroring the declines experienced by the counties in the Sacramento Economic Area. The December difference is the largest so far during this cycle at -3.43%. The decline has dropped past the lowest level of the 2001-2003 negative cycle. |
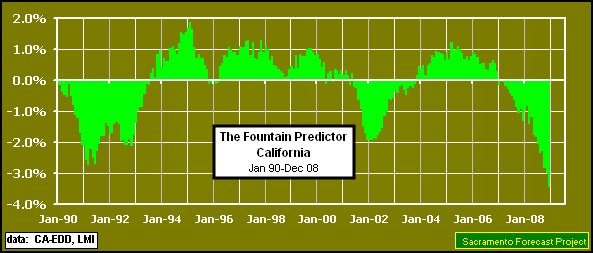 |
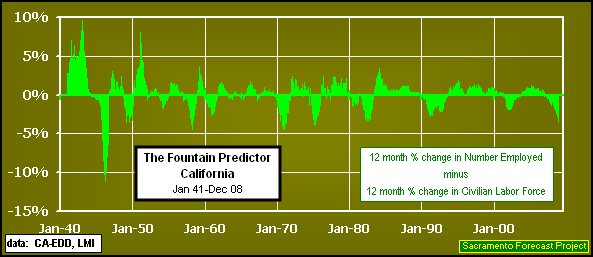
| The Fountain Predictor was named for Robert J. Fountain (Professor Emeritus, California State University, Sacramento) who suggested graphically comparing the twelve month percentage change in the Number of Persons Employed with the twelve month percentage change in the Civilian Labor Force as a measure of the economic health of an area. | The theory suggests that as long as the percentage change in the Number of Persons Employed is larger than (above) the percentage change in the Civilian Labor Force, for that area, that area is in good economic health. |
 | |
| Taxable Sales |
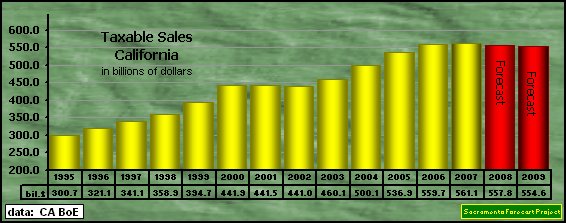
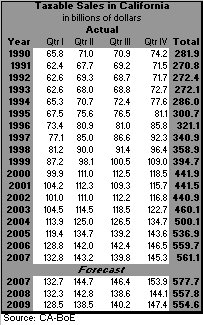
| 31Jan09: Based on actual data through the 4th quarter of 2007, California's Taxable Sales increased in 2007, by 0.25% ($1.4 billion). That was slower than the 4.24% ($22.7 billion) increase in 2006. The 2008 Taxable Sales forecast is for a decline of -0.58% (-$3.3 bil), to be followed by another -0.57% (-$3.2 bil.) increase in 2009.
The historical fifty-three year record of Taxable Sales in California and forecasts through 2009. |
 |
| Consumer Price Index |
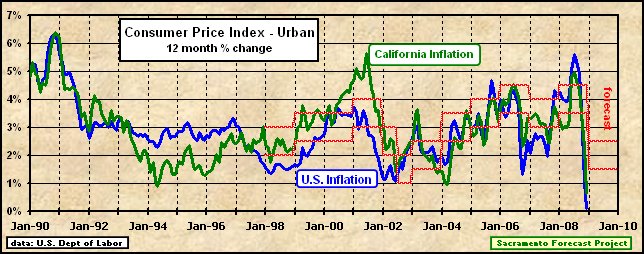
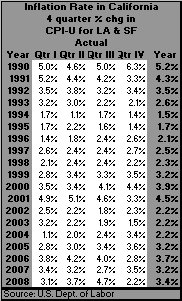
| 31Jan09: The average Inflation (percentage change in the CPI) rate for California in 2008 was 3.4% for the year, compared with the national rate of 3.84%. I exected the downward pressure on prices to continue in 2009 so I put the range between 1.5% and 2.5% for both the State and the Nation. |
 |
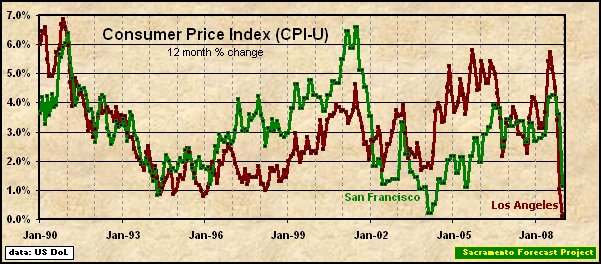
| The two metropolitan areas used for calculation of the CPI in California are the San Francisco MSA and the Los Angeles MSA. The two areas have exchanged inflationary leadership a number of times over the years. The Los Angeles MSA had leaped ahead during the early part if 2008 - bigger commute costs, but as the price of oil dropped, the Los Angeles CPI fell faster than the San Francisco CPI. |
 |
| NOTE: California's inflation rate, as calculated by the Sacramento Forecast Project, is the average of the San Francisco MSA CPI and the Los Angeles MSA CPI. The US Department of Labor has changed the reporting of the San Francisco MSA to semi-monthly (the Los Angeles CPI is still reported monthly) and calculation of the average reflects that adjustment. For those months that no CPI is reported, the average is calculated using the previous month's CPI. |
| Data Tables | |||
| The Sacramento Forecast Project maintains files for these variables and the supporting variables for California, in Excel format, that can be made available on request. | |||
 |
|||
 |
|||
 |
|||
 |
 |
||
| Resources |
|
Want another forecast... Checkout the UCLA - Anderson Business Forecast. Data Providers: |
|
Back to Sacramento Forecast Project Update: January, 2009 Next Revision: July, 2009 Arthur N. Jensen, Emeritus Professor of Marketing e-mail to: a.jensen@comcast.net Disclaimer: Professor Arthur N. Jensen takes full responsibility for the information posted. The information on this page represents that of Professor Arthur N. Jensen and not that of California State University, Sacramento. [as required in PM BA 96-13 Policy on CSUSInfo World Wide Web] |