| Sacramento Forecast Project | El Dorado County Economic Forecast | California State University, Sacramento |
| revised January, 2009 | ||
| Unemployment | Fountain Predictor | Taxable Sales | Building Permits | Data Tables | Resources | SFP Page | ||
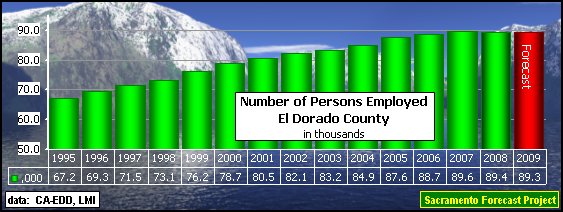
| Number of Persons Employed |
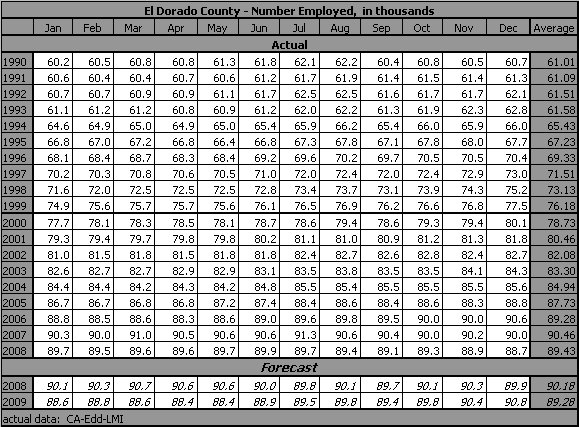
| The average number of persons employed (as measured by the Household Survey) in El Dorado County declined 0.1% (200 persons) in 2008, reversing some of the 0.8% increase in 2007. The forecast for 2009, based on actual data through December,2008, is for another 0.1% (100 persons) decline. |
|

| Unemployment |
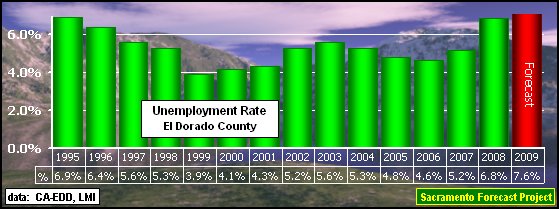 |
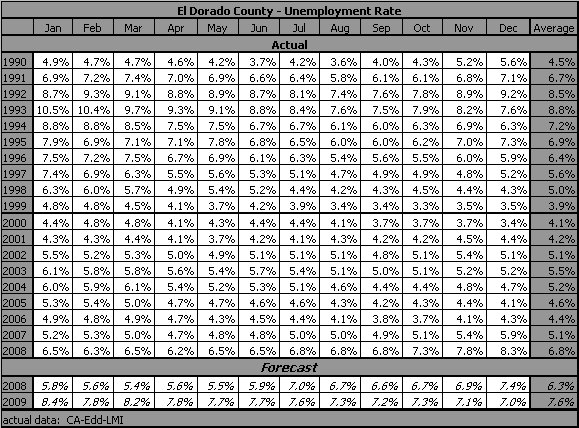
| The average annual Unemployment Rate for El Dorado County increased in 2008 to 6.8%, up from the 5.2% annual average rate in 2007. The forecast for the annual rate, based on actual data through December,2008, is for an even higher 7.6% in 2009. |
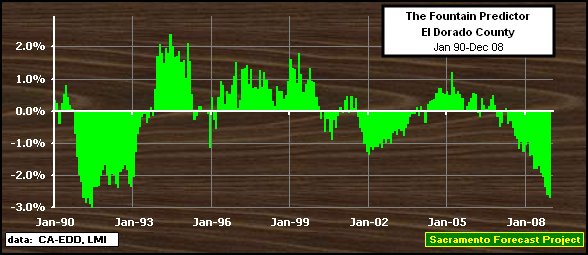
| Fountain Predictor | |
 |
|
| 1/21/06: The Predictor has been negative since May, 2007 with a general pattern of increasing negativity. The December value of -2.697% is just the latest of a continuing pattern that exceeds the negative levels of the previous negative cycle (2002-2003) and is very close to the negative levels reached in the early 1990's. | |
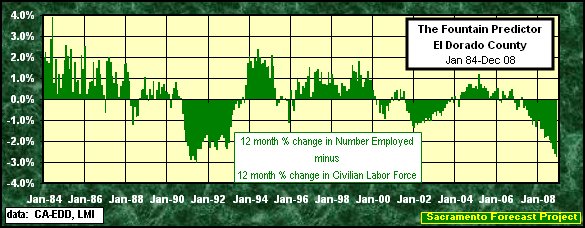 | |
| The Fountain Predictor was named for Robert J. Fountain (Professor Emeritus, California State University, Sacramento) who suggested graphically comparing the twelve month percentage change in the Number of Persons Employed with the twelve month percentage change in the Civilian Labor Force as a measure of the economic health of an area. | The theory suggests that as long as the percentage change in the Number of Persons Employed is larger than (above) the percentage change in the Civilian Labor Force, for that area, that area is in good economic health. |
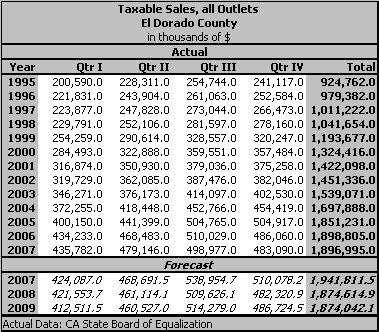
| Taxable Sales |
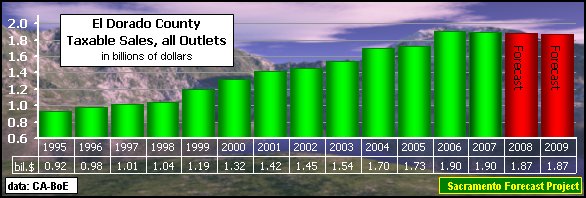
| Taxable Sales for all Outlets, in 2007, were virtually unchanged from the $1.9 billion reached in 2006. The forecast for 2008, based on actual data through the 4th quarter of 2007, is for an decrease of -1.2% to $1.87 billion and unchanged in 2009. |
 |
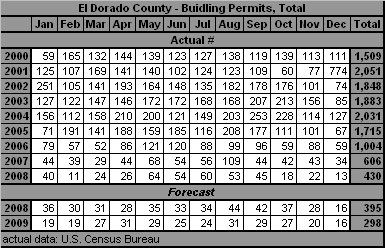
| Building Permits |
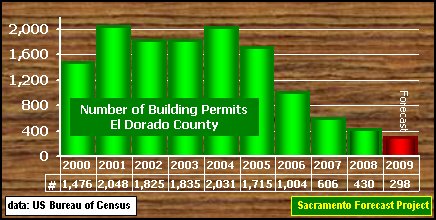
| Residential Building Permits (total units) in El Dorado County declined from the high of 2,031 residential permits in 2004, to 1,715 permits in 2005 (a 15.6% decline), dropped another 41.5% to 1,004 permits in 2006, down another 39.6% to 606 permits issued in 2007 and the decline continued through 2008, which ended with a slightly smaller 28.6% decline to 433 permits issued. The forecast for 2009 using actual data through December, 2008 by another 31.1% decline to 298 permits. |
 |
| Data Tables | |
| The Sacramento Forecast Project maintains files for these variables and the supporting variables for El Dorado County, in Excel format, that can be made available on request. | |
 | |
 | |
 | |
 | |
| Resources |
El Dorado County has several useful and informative locations on the Internet. For information about the county and its environment, try:
Data Providers: |
|
Back to Sacramento Forecast Project Update: January, 2009 Next Revision: July, 2009 Arthur N. Jensen, Emeritus Professor of Marketing e-mail to: a.jensen@comcast.net California State University, Sacramento Disclaimer: Professor Arthur N. Jensen takes full responsibility for the information posted. The information on this page represents that of Professor Arthur N. Jensen and not that of California State University, Sacramento. [as required in PM BA 96-13 Policy on CSUSInfo World Wide Web] |