| Sacramento Forecast Project | Placer County Economic Forecast | California State University, Sacramento |
| revised January, 2009 | ||
| Unemployment | Fountain Predictor | Taxable Sales | Building Permits | Data Tables | Resources | SFP Page | ||
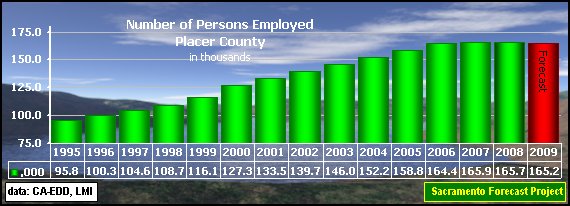
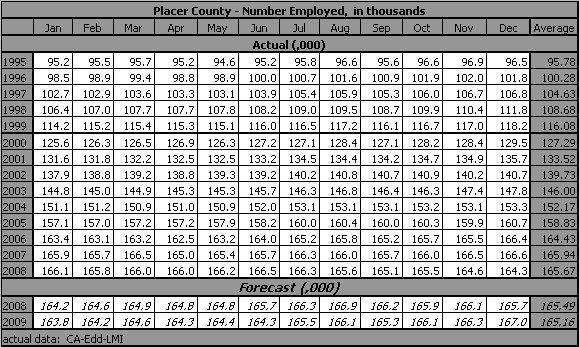
| Number of Persons Employed |
| The average number of persons employed (as measured by the Household Survey) in Placer County decreased at a 0.2% (280 persons) in 2008, down from the 0.9% increase in 2007. The forecast for 2009, based on actual data through december,2008, is for a larger decrease of 0.3% (510 persons). |
|

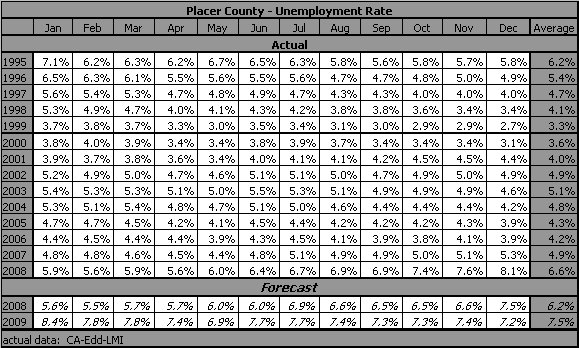
| Unemployment |
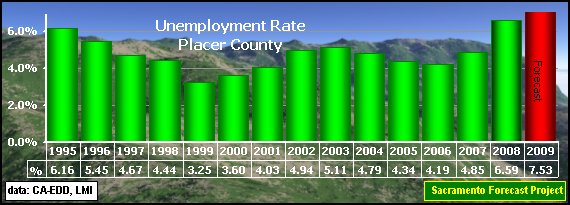 |
| The Unemployment Rate in Placer County increased over one and one-half percent in 2008, to 6.6%, up from 4.85% in 2007. The forecast for 2009, based on actual data through December, 2008, is another increase to 7.5%. |
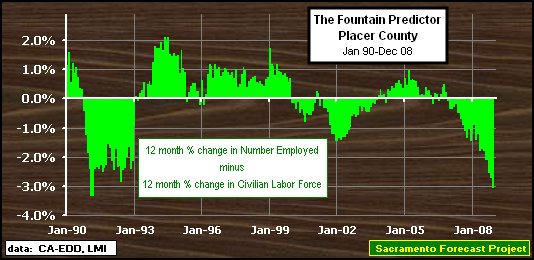
| Fountain Predictor | |
 |
|
| The Predictor turned negative in December of 2006 and has remained negative for 25 months, with the biggest negative coming in the most recent period (December = -3.029). The negative values are, generally, the result of the Labor Force continuing to grow while the Number of Persons Employed declines. | |
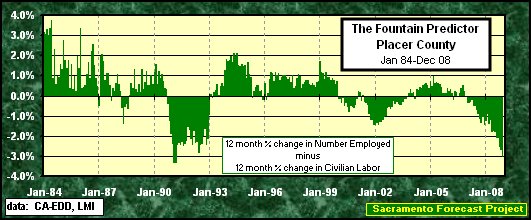 | |
| The Fountain Predictor was named for Robert J. Fountain (Professor Emeritus, California State University, Sacramento) who suggested graphically comparing the twelve month percentage change in the Number of Persons Employed with the twelve month percentage change in the Civilian Labor Force as a measure of the economic health of an area. | The theory suggests that as long as the percentage change in the Number of Persons Employed is larger than (above) the percentage change in the Civilian Labor Force, for that area, that area is in good economic health. |
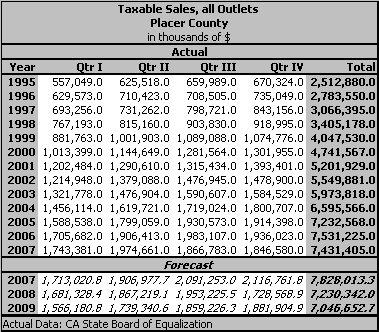
| Taxable Sales |
 |
| Taxable Sales, all Outlets in 2007 declined at a 1.3% ($100. million) rate, down from the 4.1% increase in 2006. The forecast for 2008, based on actual data through the 4th quarter of 2007, is for a decrease of 2.7% followed by a similar increase of 2.5% in 2009. |
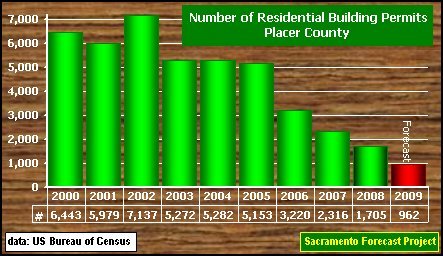
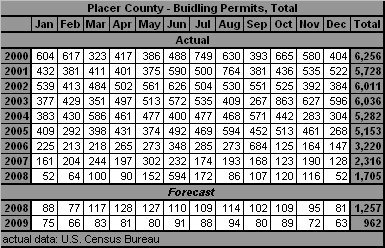
| Building Permits |
| Residential Building Permits (total units) in Placer County declined from the high of 7,137 residential permits in 2002, to 3,220 permits in 2006 (a 54.8% decline). The decline continued in 2007 with a 28.1% drop to 2,316 residential permits issued and again in 2008, with a decline of -25.1% to 1,734 permits issued. The forecast for 2009. based on actual data through December, 2008, is another decline of -44.6%. |
 |
| Data Tables | ||
| The Sacramento Forecast Project maintains files for these variables and the supporting variables for Placer County, in Excel format, that can be made available on request. | ||
 |
||
 |
||
 |
||
 |
||
| Resources |
Placer County has several useful and informative locations on the Internet. For information about the county and its environment, try:
Data Providers: |
|
Back to Sacramento Forecast Project Update: January, 2009 Next Revision: July, 2009 URL: http://www.csus.edu/indiv/j/jensena/sfp/sa11/sac5/pla/placer.htm Arthur N. Jensen, Emeritus Professor of Marketing e-mail to: a.jensen@comcast.net California State University, Sacramento Disclaimer: Professor Arthur N. Jensen takes full responsibility for the information posted. The information on this page represents that of Professor Arthur N. Jensen and not that of California State University, Sacramento. [as required in PM BA 96-13 Policy on CSUSInfo World Wide Web] |