| Sacramento Forecast Project | Sacramento County Economic Forecast | California State University, Sacramento |
| revised January, 2009 | ||
| Unemployment | Fountain Predictor | Taxable Sales | Building Permits | Data Tables | Resources | SFP Page | ||
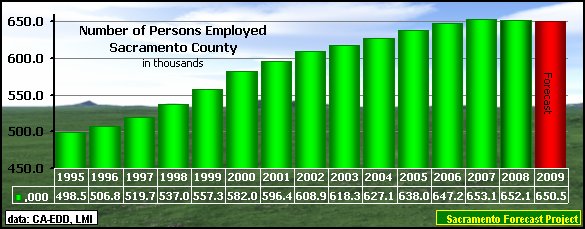
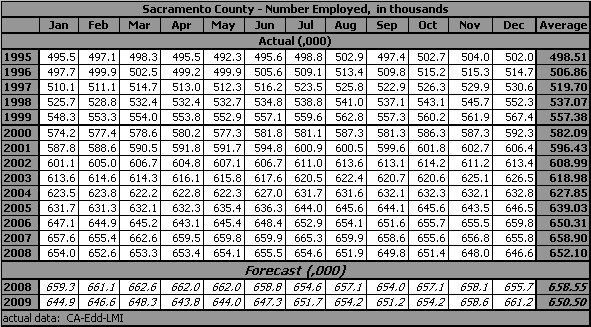
| Number of Persons Employed |
| The average number of persons employed (as measured by the Household Survey) in Sacramento County decreased 0.16% (1,040 persons) rate in 2008, a reversal from the 0.9% increase in 2007. The forecast for 2009, based on actual data through December, 2008, is for another decline of 0.24% (1,600 persons). |
|

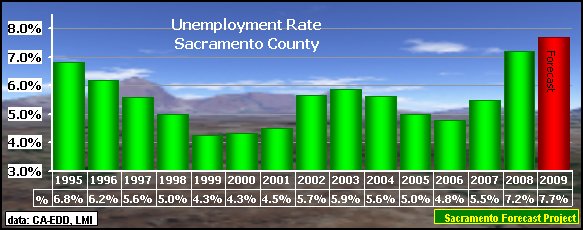
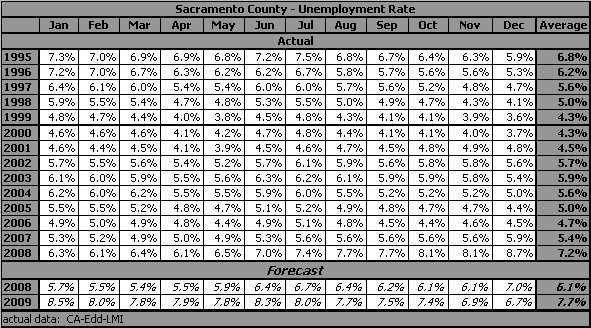
| Unemployment |
| The annual average Unemployment Rate for Sacramento County increased from the 5.5% for 2007 to 7.2% in 2008. The forecast for 2009, based on actual data through Deember,2008, is another increase to 7.7%. |
 |
| Fountain Predictor | |
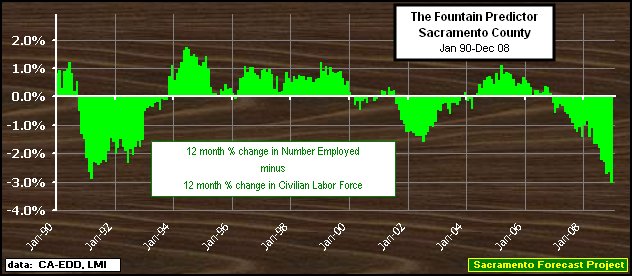 | |
| The Predictor has remained negative for 25 months and the negative values have generally been getting more and more negative as the months have passed with the largest negatives coming in December (December = -3.023), exceeding the largest negative value of this century (-1.557% in July, 2002). The Labor Force in Sacramento County continues to grow while the number of persons employed is declining. It does not appear likely that situation will change for the better in the near future. | |
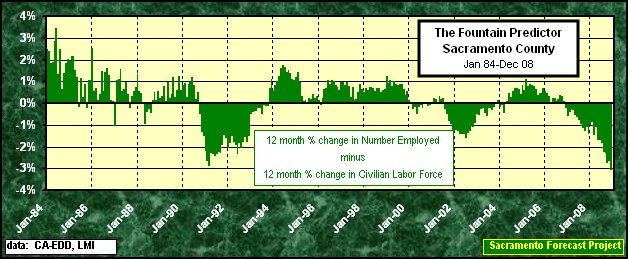 | |
| The Fountain Predictor was named for Robert J. Fountain (Professor Emeritus, California State University, Sacramento) who suggested graphically comparing the twelve month percentage change in the Number of Persons Employed with the twelve month percentage change in the Civilian Labor Force as a measure of the economic health of an area. | The theory suggests that as long as the percentage change in the Number of Persons Employed is larger than (above) the percentage change in the Civilian Labor Force, for that area, that area is in good economic health. |
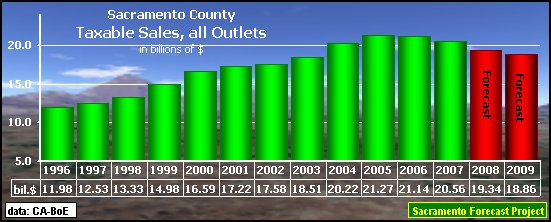
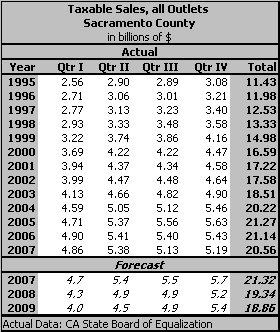
| Taxable Sales |
| Taxable Sales, all Outlets, posted a 2.74% Decrease in 2007, down from the 0.6% decrease in 2006. The forecast for 2008, based on actual data through the 4th quarter of 2007, is for a 1.5% decrease ($1.22 billion); followed by a better 2.5% decrease in 2009. |
 |
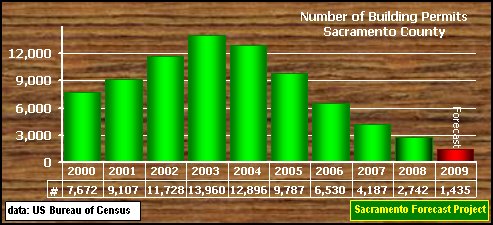
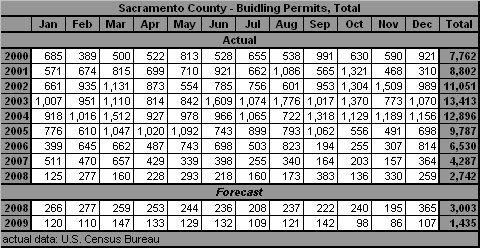
| Building Permits |
| Residential Building Permits (total units) in Sacramento County declined from the high of 13,960 residential permits in 2003, to 6,218 permits in 2006 (a 55.5% decline). The decline continued in 2007 with a 35.9% decline, ending with 4,187 residential permits issued for the year and the 2008 result was similar with a -34.5% decline to 2,742 permits. The forecast for 2009, using actual data through December,2008, is a 47.7% decline. |
 |
| Data Tables | ||
| The Sacramento Forecast Project maintains files for these variables and the supporting variables for Sacramento County, in Excel format, that can be made available on request. | ||
 |
||
 |
||
 |
||
 |
||
| Resources |
For information about the county and its business environment, try
Data Providers: |
|
Back to Sacramento Forecast Project Update: January, 2009 Next Revision: July, 2009 URL: http://www.csus.edu/indiv/j/jensena/sfp/sa11/sac5/sac/sacramen.htm Arthur N. Jensen, Emeritus Professor of Marketing e-mail to: a.jensen@comcast.net California State University, Sacramento Disclaimer: Professor Arthur N. Jensen takes full responsibility for the information posted. The information on this page represents that of Professor Arthur N. Jensen and not that of California State University, Sacramento. [as required in PM BA 96-13 Policy on CSUSInfo World Wide Web] |