| Sacramento Forecast Project | Yolo County Economic Forecast | California State University, Sacramento |
| revised January, 2009 | ||
| Unemployment | Fountain Predictor | Taxable Sales | Building Permits | Data Tables | Resources | SFP Page | ||
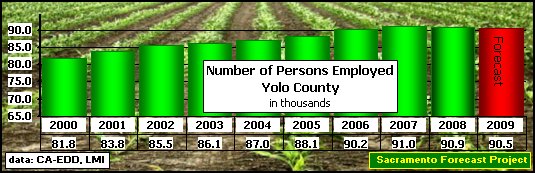
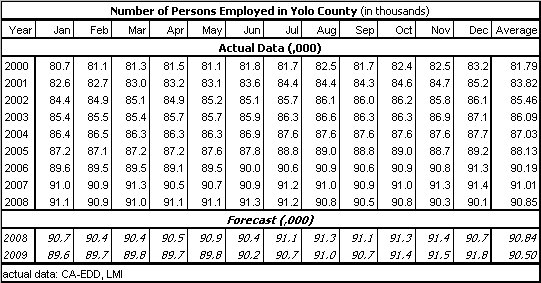
| Number of Persons Employed |
| The number of persons employed (as measured by the Household Survey) in Yolo County decreased 0.17% (200 persons) rate in 2008, a reversal from the 0.9% (800 persons) increase in 2007. The forecast for 2009, based on actual data through December,2008, is for another decline of -0.39% (400 persons). |
|

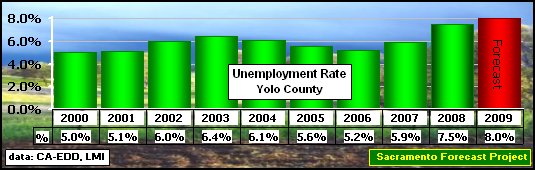
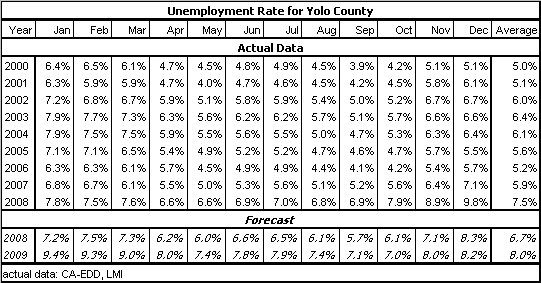
| Unemployment |
| The Yolo County annual Unemployment Rate for 2008 was 7.5%, up from the 5.9% rate in 2007. The forecast for 2009, based on actual data through December, 2008, is a higher annual rate of 8.0%. |
 |
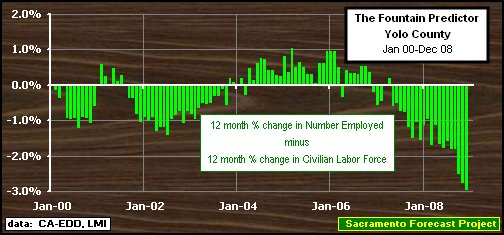
| Fountain Predictor | |
| The Predictor for Yolo County has been negative for the last 20 months, beginning with May 2007 and the most recent value, for December, 2008, was the largest negative in the current negative pattern (-2.947%). Since August, 2008, the number of persons employed in the county has declined each month while the civilian labor force has increased. | |
 |
|
| The Fountain Predictor was named for Robert J. Fountain (Professor Emeritus, California State University, Sacramento) who suggested graphically comparing the twelve month percentage change in the Number of Persons Employed with the twelve month percentage change in the Civilian Labor Force as a measure of the economic health of an area. | The theory suggests that as long as the percentage change in the Number of Persons Employed is larger than (above) the percentage change in the Civilian Labor Force, for that area, that area is in good economic health. |
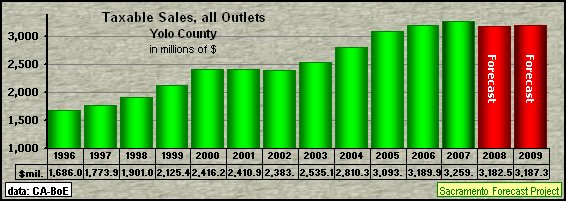
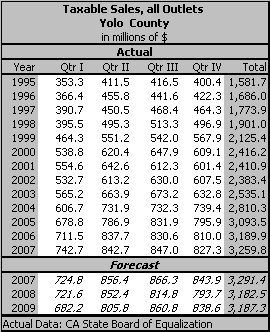
| Taxable Sales |
| Taxable Sales from all Outlets in Yolo County increased $70.0 million (2.2%) in 2007, to a total of $3,259.8 million. The 2.2% increase was lower than the 3.1% increase in 2006 and the 10.1% increase in 2005. The forecast for 2008, based on actual data through the 4th quarter of 2007, is for a 2.4% ($77.3 million) decrease, followed by a tiny increase of 0.15% in 2009. |
 |
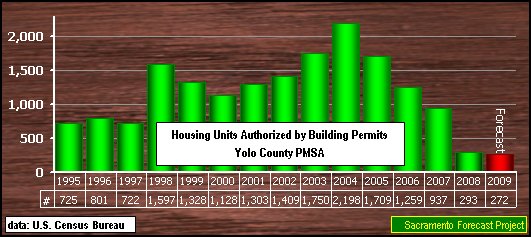
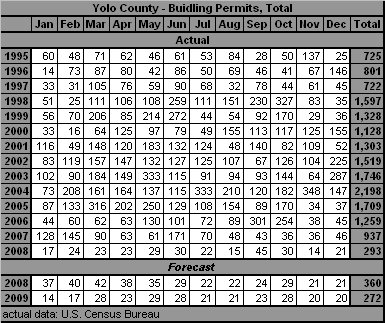
| Building Permits |
| Residential Building Permits in Yolo County have fallen considerably since the peak of 2,198 residential permits in 2004. There were 489 fewer permits issued in 2005, a decline of 22.2% from the previous year. 2006 had another decline of 450 permits, a 26.3% decline and 2007 saw another 25.6% decline and 2008 topped the "percentage change race" with a 68.75% to 293 permits issued. The forecast for 2009, based on actual data through December, 2008, is for a much smaller decline of 7.3% (decline of another 21 permits). |
 |
| Data Tables | |
| The Sacramento Forecast Project maintains files for these variables and the supporting variables for Yolo County, in Excel format, that can be made available on request. | |
 |
|
 |
|
 |
|
 |
|
| Resources |
Yolo County has several useful and informative locations on the Internet:
The State of California maintains:
|
|
Back to Sacramento Forecast Project Update: January, 2009 Next Revision: July, 2009 URL: http://www.csus.edu/indiv/j/jensena/sfp/sa11/yol2/yol/yolo.htm Arthur N. Jensen, Emeritus Professor of Marketing e-mail to: a.jensen@comcast.net California State University, Sacramento Disclaimer: Professor Arthur N. Jensen takes full responsibility for the information posted. The information on this page represents that of Professor Arthur N. Jensen and not that of California State University, Sacramento. [as required in PM BA 96-13 Policy on CSUSInfo World Wide Web] |