| Sacramento Forecast Project | Sutter County Economic Forecast | California State University, Sacramento |
| revised January, 2009 | ||
| Unemployment | Fountain Predictor | Taxable Sales | Data Tables | Resources | SFP Page | ||
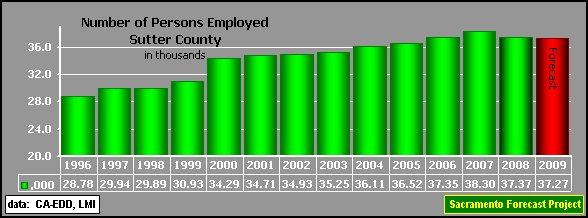
| Number of Persons Employed |
| The average number of persons employed (as measured by the Household Survey) in Sutter County decreased 2.44% (930 persons) in 2008, almost erasing the 2.5% increase in 2007. The forecast for 2009, based on actual data through December,2008, is for a slightly negative 0.3% decline (loss of another 100 jobs). |
|

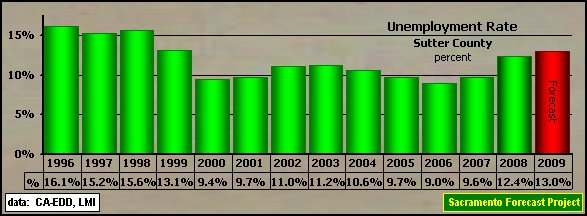
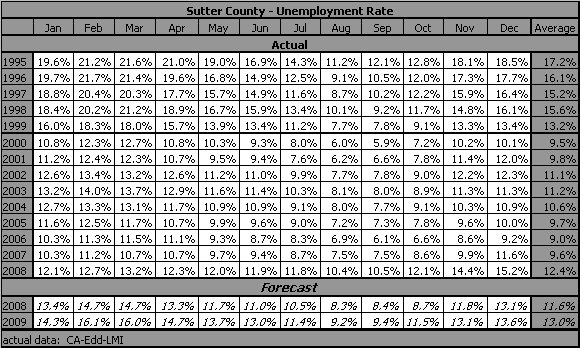
| Unemployment |
| The average annual Unemployment Rate in Sutter County for 2008 was 12.4%, up from the 9.6% rate in 2007. The average annual rate for 2009, based on actual data through December. 2008, is forecasted to stay above the double-digit level at 13.0%. |
 |
| Fountain Predictor | |
| 8/6/08: The Predictor turned negative in May, 2007 and that negativity has been particularily strong with the difference between the twelve month percentage change in the Civilian Labor Force exceeding the twelve month percentage in the Number of Persons Employed by more than three percentage points and exceeding 5 percentage points in November, 2008 (-5.015%). Translated, that means the number of persons in Sutter County looking for work grew five percent or faster than the employment opportunities. | |
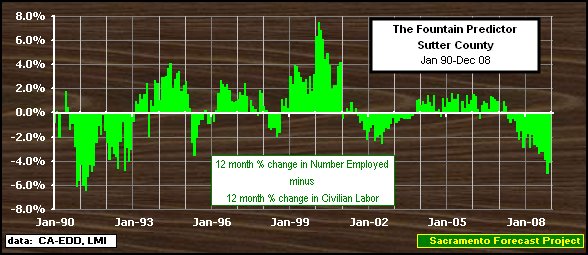 | |
| The Fountain Predictor was named for Robert J. Fountain (Professor Emeritus, California State University, Sacramento) who suggested graphically comparing the twelve month percentage change in the Number of Persons Employed with the twelve month percentage change in the Civilian Labor Force as a measure of the economic health of an area. | The theory suggests that as long as the percentage change in the Number of Persons Employed is larger than (above) the percentage change in the Civilian Labor Force, for that area, that area is in good economic health. |
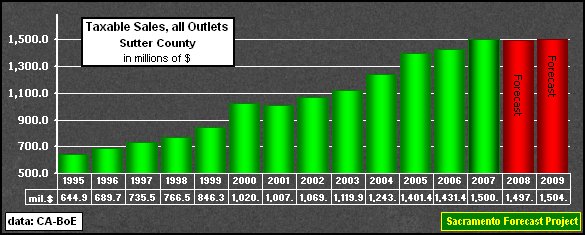
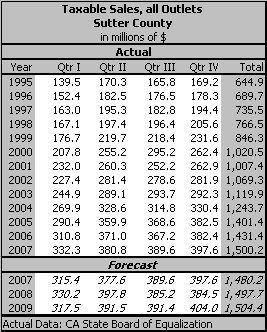
| Taxable Sales |
| The growth in Taxable Sales, all Outlets, in 2007 was an increase of $69 million (4.8%) to $1,500.2 million, faster than 2.1% increase in 2006. The forecast for 2008, based on actual data through the 4th quarter of 2007, is for a 0.2% decrease, followed by a slightly better 0.4% increase in 2009. |
 |
| Data Tables | |
| The Sacramento Forecast Project maintains files for these variables and the supporting variables for Sutter County, in Excel format, that can be made available on request. | |
 | |
 | |
 |
|
| Resources | ||
Sutter County has several useful and informative locations on the Internet:
Data Providers: |
||
|
Back to Sacramento Forecast Project Update: January, 2009 Next Revision: July, 2009 URL: http://www.csus.edu/indiv/j/jensena/sfp/sa11/yub2/sut/sutter.htm Arthur N. Jensen, Emeritus Professor of Marketing e-mail to: a.jensen@comcast.net California State University, Sacramento Disclaimer: Professor Arthur N. Jensen takes full responsibility for the information posted. The information on this page represents that of Professor Arthur N. Jensen and not that of California State University, Sacramento. [as required in PM BA 96-13 Policy on CSUSInfo World Wide Web] |