| Sacramento Forecast Project | Variable Comparison: United States vs California vs Sacramento MSA | California State University, Sacramento |
| revised January, 2009 | ||
| Establishment Survey | Transportation | Residential Construction | SFP Page | ||
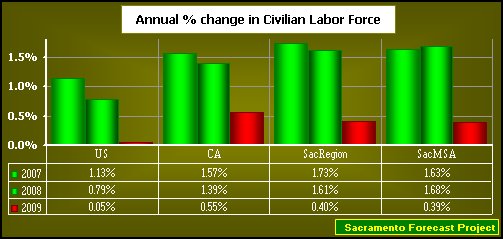
| What follows is a graphical comparison of the ecomonic activity of a number of variables across several geographic divisions; usually the US compared to California and one or more of the Sacramento geographic id's. In all instances, the comparison is in the form of annual percentage changes to allow direct comparison among the areas. I am experimenting with several ways of presenting the percentages, using bar graphs and line graphs, to communicate the relaionships. |
| Household Survey |
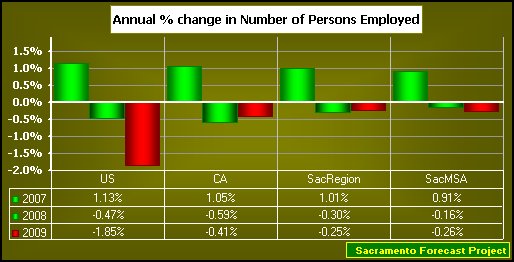
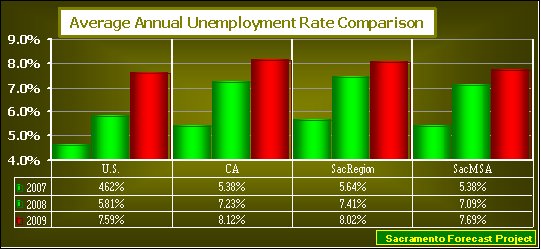
| I'm using the title "Household Survey" to identify the "Current Population Survey", a monthly household survey conducted by the Bureau of the Census for the Bureau of Labor Statistics, which provides a comprehensive body of information on the employment and unemployment experience of the Nation's population, classified by age, sex, race, and a variety of other characteristics. The specifics of the survey are explained in a document entitled How the Government Measures Unemployment. |
|
|
|

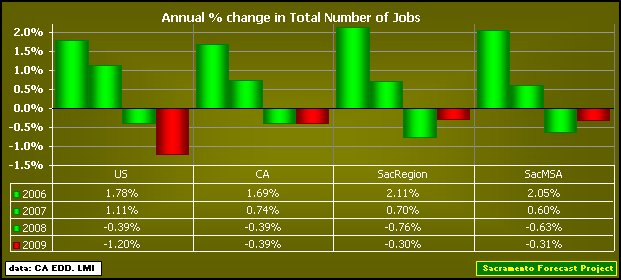
| Establishment Survey |
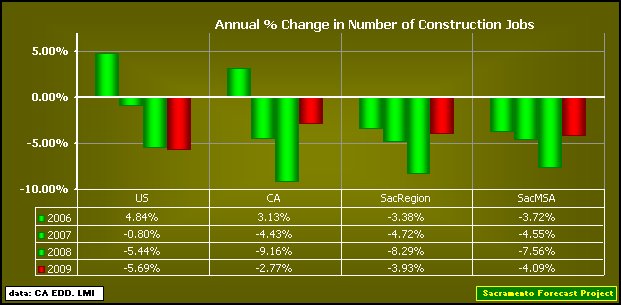
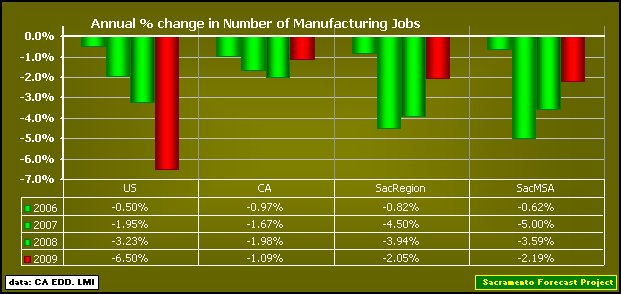
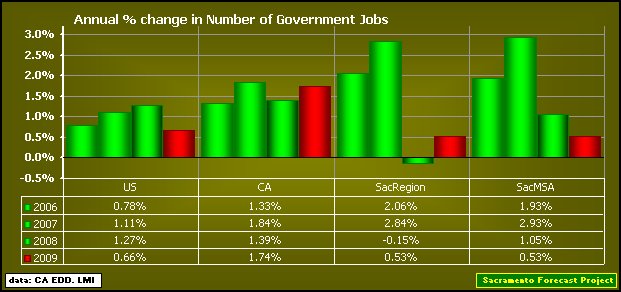
| I'm using the title "Establishment Survey" to identify the "Current Employment Statistics" (CES) program conducted by the Bureau of Labor Statistics of the Department of Labor and which surveys about 160,000 businesses and government agencies, representing approximately 400,000 individual worksites, in order to provide detailed industry data on employment, hours, and earnings of workers on nonfarm payrolls. |
 |
 |
 |
 |
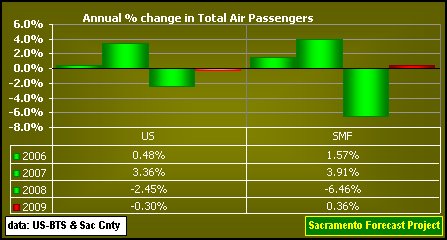
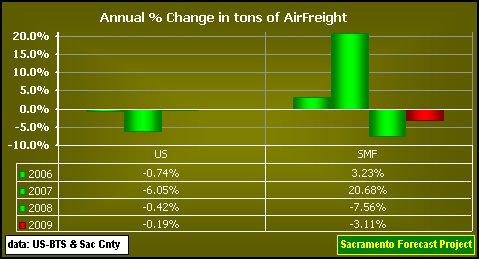
| Transportation |
 |
 |
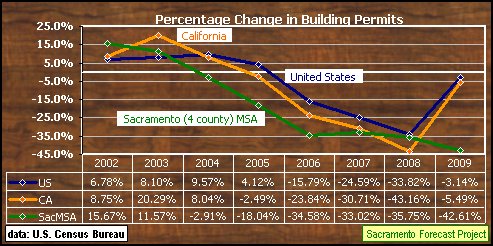
| Residential Construction |
 |
| Back to Sacramento Forecast Project Update: January, 2009 Next Revision: July, 2009 URL: http://www.csus.edu/indiv/j/jensena/sfp/variable/variable.htm Arthur N. Jensen, Emeritus Professor of Marketing e-mail to: a.jensen@comcast.net California State University, Sacramento Disclaimer: Professor Arthur N. Jensen takes full responsibility for the information posted. The information on this page represents that of Professor Arthur N. Jensen and not that of California State University, Sacramento. [as required in PM BA 96-13 Policy on CSUSInfo World Wide Web] |