|
Case 1: For a Population Mean when Population
Standard Deviation is Known
The following example illustrates the idea of confidence
level in the case where the population standard deviation is known. Confidence level
is illustrated by taking the following steps:
|
The computer was instructed to generate 100 random samples of size 5 from
this population. The first 5 samples were
{{6,3,4,4,5},{1,5,2,1,4},{3,1,1,2,3},{3,4,3,7,4},{1,1,2,2,2}}. Next, the mean of
each of the 100 samples was computed. For the 5 samples shown, the means are
{4.4,2.6,2.,4.2,1.6}. From these means 95% confidence intervals were constructed.
The confidence intervals for the 5 sample means shown are
{{2.76015,6.03985},{0.960145,4.23985},{0.360145,3.63985},{2.56015,5.83985},{-0.0398548,3.23985}}.
Each of the confidence intervals is called good if it contains the mean (3.5) and
bad if it doesn't. For the five confidence intervals shown the first 4 are good and
the last one is bad. For the 100 confidence intervals 94 are good and 6 are bad.
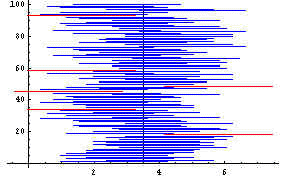
In another case in which 100 random samples were selected from the same
population and 95% confidence intervals were computed for each of the samples, a picture
of the mean (vertical line at 3.5) together with the 100 confidence intervals is shown in
the next graph. For this example, 6 of the confidence intervals shown as red
horizontal lines are bad while 94 of the confidence intervals shown as blue horizontal
lines are good.
For a 95% confidence interval in the long run 95% of the confidence
intervals will contain the population mean. The examples shown above have
approximately this property. Follow this link
to a demonstration of a confidence interval for the population mean.
When the page opens, press the red die in front of exercise 2 to open the
demonstration.
|
Case 2: For a Population Mean when Population
Standard Deviation is Unknown
In sampling from a normal population with known standard
deviation, the distribution of sample means is normal with mean equal to the
population mean and standard deviation equal to the standard deviation of the population
divided by the square root of the sample size. If a large number of samples are
taken from a population with mean mu and standard deviation sigma, if the mean,
xbar, of
each sample is computed, then the distribution of (xbar-mu)/(sigma/Sqrt(n)) should be
standard normal.
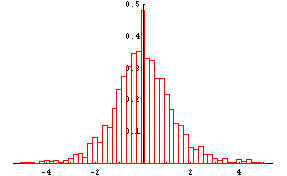
To illustrate the last point 2000 samples each of size 5
were taken from a normal population with mean, mu=20, and standard deviation, sigma=5.
For each sample (xbar-20)/(5/Sqrt(5)) was computed. A histogram of these
numbers is shown next. |
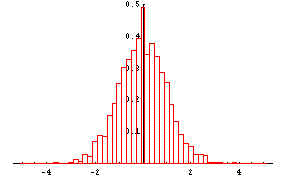
This histogram appears to be the histogram of a standard
normal random variable. The theory of sampling distribution of the sample mean tells
us that it is the histogram of a standard normal random variable.
Now assume that we didn't know the population standard
deviation. For each of the 2000 samples xbar and s, the sample standard deviation,
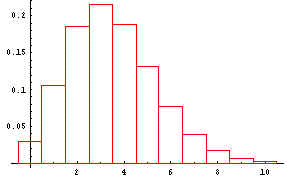
were computed. The next histogram is a histogram of (xbar-20)/(s/Sqrt(5)).
This histogram is symmetric about 0, and looks very much like the standard
normal curve in the previous histogram. But notice that this histogram is more
spread out than the standard normal curve. The statistician Gosset showed that the
distribution from which this histogram comes is not the normal. It is called the
t-distribution or Student's t-distribution with 4 degrees of freedom.
The next section illustrates the idea of confidence level
in the case where the population standard deviation is unknown but the population is
normally distributed. Confidence level is illustrated by taking the following steps:
| Generate a number of samples of size n from a population with known mean and unknown
standard deviation. |
| For each sample compute the sample mean, named xbar, and the sample standard deviation
named s. |
| Use the sample mean, xbar, and the sample standard deviation, s, to construct a
confidence interval of specified confidence level. If a 95% confidence interval can
be constructed using the normal distribution (as it was when the population standard
deviation was known), the confidence interval would run from xbar-1.96(s/Sqrt[n]) to
xbar+1.96(s/Sqrt[n]). Intervals of this type are constructed. If they are
proper 95% confidence intervals, and the experiment is repeated many times about 95% of
the confidence intervals would contain the population mean. |
| Test whether that confidence interval is good (includes the population mean) or bad
(doesn't include the population mean). |
Suppose the population has a normal probability distribution with a mean of 20 and an
unknown standard deviation. If a random sample of size 5 is taken from this
population, a 95% confidence interval similar to one where the population standard
deviation is known would be xbar-1.96(s/Sqrt[5]) to xbar+1.96(s/Sqrt[5]) where s, the
standard deviation of the sample, replaces sigma, the population standard deviation.
However, if the resulting 95% confidence interval 'works' in 95% of cases, the
confidence interval should contain the population mean. When 2000 samples were taken
and 95% confidence intervals generated using the formula in the middle of this paragraph,
number of bad confidence intervals was 242. This is about twice the number of bad
confidence intervals that would be expected if the confidence intervals were proper 95%
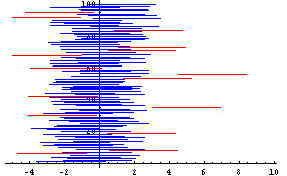
confidence intervals. The following graph shows bad confidence intervals in red when
100 random samples were taken--note that 15 do not intersect the vertical line at the
center representing the mean. If this formula had produced a 95% confidence interval
only about 5 of the lines would be red.
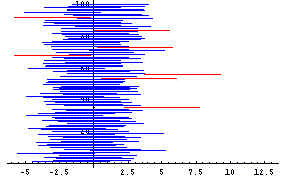
Next, confidence intervals were computed as xbar-2.776(s/Sqrt[5]) to
xbar+2.776(s/Sqrt[5]). The number 2.776 is the t-value associated with a 95%
confidence interval for a t-distribution with 4 degrees of freedom. The next diagram
shows the result of taking 100 samples and using this formula to compute confidence
intervals. Only 7 of them are bad (in red). For a 95% confidence interval, in
the long run 5 out of 100 should be bad. When the same procedure was run 2000 times,
98 of the confidence intervals were bad--theory says that in the long run 100 out of 2000
should be bad so 98 is in line with theory.
| Confidence Interval for a Single Population Proportion
|
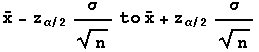
In finding a confidence interval for a population mean where the
population standard deviation is known, you use the fact that the distribution of sample
means for samples of size n is approximately normal with mean equal to the mean of the
population from which samples are taken and standard deviation equal to the standard
deviation of the population from which samples are taken divided by the square root of the
sample size. Then

is approximately normally distributed with mean 0 and standard deviation
1, i.e. it has an approximate standard normal distribution. In finding the
confidence interval for the population mean, z-values corresponding to the confidence
level are found (e.g. for 95% confidence, z=-1.96 or z=1.96), and in the equation just
above everything except the population mean is known. Solving for mu, the population
mean for each of the z-values provides the ends of the confidence interval.
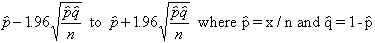
In finding a confidence interval for a population proportion, the overall
procedure is the same as that of finding a confidence interval for a population mean, but
some modification is necessary. Assume that proportion, p, of a population has some
characteristic, say for example, brown eyes. To find a confidence interval for p a
random sample of size n is taken and the number of people in the sample with the
characteristic, brown eyes, is found. Call this number x. Then an estimate of
the population proportion would be phat=x/n. To find a 95% confidence interval for
p, use the fact that the distribution of phat is approximately normal (because it is a
sample mean and must therefore follow the Central Limit principle), the expected or mean
value of phat is p, and the standard deviation of phat is Sqrt[p(1-p)/n]. Then, as
in the case of the sample mean
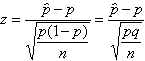
If the z-values corresponding to the 95% confidence level are found (-1.96
and 1.96), and placed in the last equation, solving for p is more difficult because p
appears both in the numerator and inside a square root symbol in the denominator.
This difficulty is usually handled by replacing p and q in the denominator by x/n and
1-(x/n), respectively. This leads to the following equation for the confidence
interval.
Is this a proper confidence interval? The answer is yes if in the
long run, 95% of intervals include the population proportion, p, or conversely, 5% of the
intervals don't include p. To check this a coin with probability of heads=0.7 was
tossed n times where n took values starting with 30 and ending with 100. The number
of heads in n tosses is the x in the last equation. Using this x with the last
formula a confidence interval for p was found. Since the value of p is known (0.7),
if the confidence interval included 0.7 it was a 'good' confidence interval and if it
didn't include 0.7 it was a 'bad' interval. This was repeated 10,000 times.
The proportion of good intervals is shown in the next table.
n |
Proportion of 'Good' C.I.'s |
| 30 |
0.951 |
40 |
0.927 |
50 |
0.936 |
60 |
0.947 |
70 |
0.944 |
80 |
0.950 |
90 |
0.947 |
100 |
0.941 |
Since the proportion of 'good' intervals is about 0.95, the confidence interval with p
and q replaced x/n and 1-(x/n), respectively, seems to work. It can be shown
mathematically to work for large n--n should be at least 100 for good results. The link
shown below opens the WebStat 2.0
package. This can be used to find
confidence intervals discussed above.
|
|
 .
.