This link takes you to a
page which discusses the sampling distribution of sample means. When you reach
the page click the red die in front of exercise 1 to run a simulation showing the
distribution of sample means.
-
Sampling without Replacement
- Example 1: The population from which samples are selected is
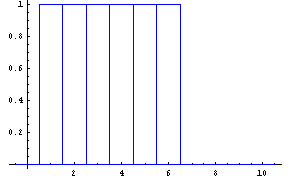
{1,2,3,4,5,6}.
A computer selected all samples of size 4 without replacement from this population. There are 360 such samples. Then the mean of each sample was taken. The mean of all of these sample means is 3.5, and the standard deviation is 0.540062. So the mean of the sample means equals the mean of the population from which the samples are selected. However, the standard deviation does not follow the rule expressed above. Dividing the population standard deviation (found in example 1 in the section on sampling with replacement), 1.70783, by the square root of the sample size, 2, results in the number 0.853915, which is not the standard deviation of the sample means, 0.540062.
In sampling without replacement, the formula for the standard deviation of all sample means for samples of size n must be modified by including a finite population correction. The formula becomes: where N is the population size, N=6 in this example, and n is the sample
size, n=4 in this case. The finite population correction is the
the second square root in this formula. Using this formula, you
get the correct standard deviation for the the population of 360 sample
means, namely, 0.540062.
Most of the time sampling is done without replacement. However, when n, the sample size, is less than 0.05 times the population size, N, the finite population correction can be dropped. For example, if N=1000, 0.05N = 0.05 1000=50, so if the sample size is 50 or less, the finite population correction can be dropped.
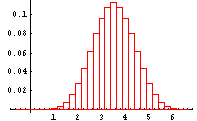
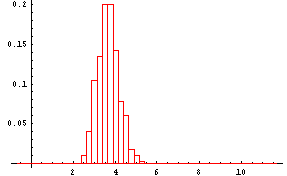
The histogram of the 360 sample means is shown next:
Histogram of all 360 Sample Means for Samples of Size 4 Taken without Replacement from Population {1,2,3,4,5,6}
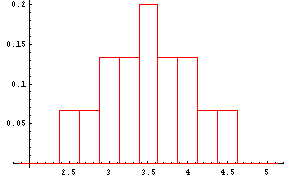
The distribution of sample means is still approximately normal.
- Example 1: The population from which samples are selected is
{1,2,3,4,5,6}.
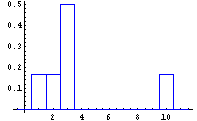
Example 2: The population from which samples are selected is {1,2,3,3,3,10}
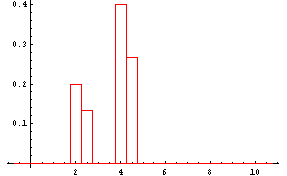
As shown in Example 2 under Sampling with Replacement, this population has a mean of 3.66667 and a standard deviation of 2.92499. Then a computer found all 360 samples of size 4 with replacement from this population and calculated the mean of each of these samples. The mean of these 360 sample means is 3.66667 and the standard deviation is 0.924962. This standard deviation is related to the standard deviation of the population by= (2.92499/Sqrt(4)) (Sqrt((6-4)/(6-1)) = (2.92499/2) (Sqrt(2/5) = 0.924962.
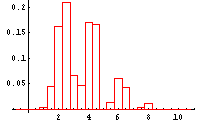
A histogram of these 360 sample means is shown next.
Histogram of all 360 Sample Means for Samples of Size 4 Taken without Replacement from Population {1,2,3,4,5,6}
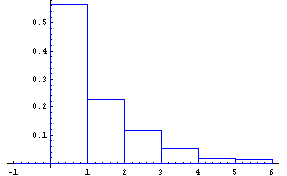
This distribution is certainly not normally distributed but it can be shown that when larger samples are taken without replacement from a population, the sample mean distribution will more closely approximate a normal distribution. This is shown in the next two graphs--the first graph shows the histogram of population of size 300 that certainly appears to be non-normal
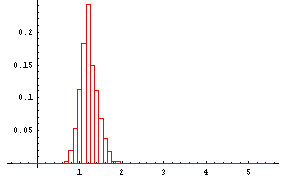
Four hundred samples of size 40 were taken from this population (population mean = 1.21986 and population standard deviation = 1.2654), and the mean of each sample was calculated. A histogram of these 400 sample means is shown next.
The mean of these sample means is 1.21703 (near 1.21986) and the standard deviation is 0.196691 (near 1.21986/Sqrt(40) = 0.19288). Note that the finite population correction factor is Sqrt((300-40)/(300-1)) = 0.93.
