![]()
![]()
![]()
![]()
![]()
![]()
MIS 183
ASSIGNMENTS - Summer 2022
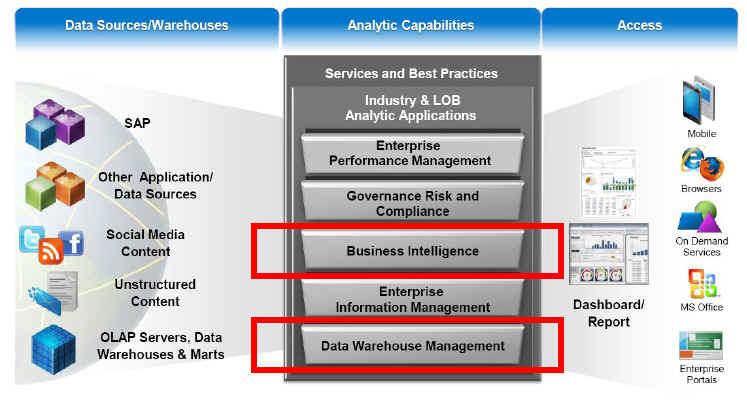
The purpose of the homework assignment is to encourage further practice of the theoretical topics covered in our book. The image below shows you the 3 major components of SAP's Business Intelligence architecture: Sources, Capabilities, and Access (think of it as Input, Process, Output).
Each assignment focuses on one of these components:
1. Peer Assignment focuses on Descriptive Analytics.
2. Individual Assignment focuses on Predictive & Prescriptive Analytics.
3.
The Team
Project focuses on using Descriptive,
Predictive & Prescriptive Analytics to
create an executive presentation.
4.
The Tableau
individual Assignment requires the use of Tableau Desktop (or Tableau Cloud) to
analyze the relationship between products and profitability, build a dashboard
with your findings, and then create a story to present. Finally, you will share
your findings on the web.
Assignment Submitting Standards:
- All assignments must be submitted on Canvas.
· When presenting your printed work, please insert your SAP screens/documentation to demonstrate the completion of each task.
|
SAP
Analytics Cloud URL: https://higher-education.us10.sapanalytics.cloud/sap/fpa/ui/app.html#/home
Assignment
1: (25 points) Peer Assignment Descriptive Analytics [top] 1.
SAP
Analytics Cloud: GlobalBikeInSAC.docx 2.
Data
Needed: GlobalBikeTransactionData_CSUS.xlsx Submit
a document which contains print screens of your answers. |
|
Assignment
2: (25 points) Individual Assignment - Predictive & Prescriptive
Analytics [top] 1. SAP Analytics Cloud: AssociationAnalysis.docx. Data Needed: AssociationAnalysisTrainData.csv,
AssociationAnalysisPredictions.csv 2. SAP Analytics Cloud: RegressionAnalysis.docx Data Needed: GB_AnalyticsData.xlsx, QuantityPrediction.xlsx 1. (optional) I downloaded the
following World Health Organization data, this week. You can use them to make
a prediction of life expectancy: LifeExpectancyData.csv
3. Work with Pivot Tables Here is a list of all calculations
required: a.
Sales (or Net Sales) =
Revenue - Discount b. Contribution
Margin = "Net Sales" - "Cost Of Goods
Sold" c. Margin
Ratio = "Contribution Margin" / "Net Sales" Using
the Microsoft Excel File BicycleForPivotV01.xls,
answer the following questions: 1. What were the Grand Total Net Sales
for the Entire Organization? (documentation: text) 2. What were the Internet Net Sales for
Munich Bike Store Sales Organization and for City bike (CB) Material Group?
(documentation: text) 3. What were the Wholesale Net for
Munich Bike Store Sales Organization and for City bike (CB) Material Group,
and for M6 Hardtrail 18" Material?
(documentation: text) 4. Show a report for Internet Net
Sales, for City bike (CB) Material Group, only in 2007, and for the months of
Jan, Feb, and March? (documentation: print screen) 5. Show a report for Wholesales sales
by Material Group, only in 2007, and for ALL months. In this report show the
Revenues, Net Sales, Contribution Margin ("Net Sales" - "Cost Of Goods Sold"), and Margin Ratio ("Contribution
Margin" / "Net Sales". (documentation: print screen) Submit
a document which contains print screens of your answers. |
|
Assignment 3: (25 points) Team Project - Develop
the Presentation Layer [top] 1. Review the Junior Achievement (JA) case
study (see PDF Document below) 2. Create your SAP Stories and provide the answers requested by JA. 3. Create
a brief presentation that includes the following: ·
Introduction
and Team Bio ·
Current
Situation, Business Requirements and Solution Overview ·
Key
print screens of your analysis KPIs ·
Summary
of Key Insights into Junior Achievement financial data and recommendations
for actions ·
A
summary of your assumptions (any assumptions that you have made) Submit
the PowerPoint presentation document and include the name of
your SAC Story Name
(one submission per team). Excel
Data Files: JA
Contributor List 2003-11_Cleaned.xlsx, JA Financial Statements
2006 -11.xls |
|
Assignment 4: (25 points) Individual Assignment -
Develop and Share a Tableau Story [top] 1. Use Tableau
Desktop to analyze the relationship between products and profitability, build
a dashboard with your findings, and then create a story to present. Additional information will be provided soon. Assignment Description: Assignment4.docx Upload your Tableau document on Canvas. |