Mammalian Fauna
at Five Finger Ridge
Mammalian Fauna
at Five Finger Ridge

The decrease in mountain sheep during Period 2A, and reduced number of artiodactyl body parts being transported to Five Finger Ridge from Period 1 to Period 2B, suggests that hunters may have been traveling greater distances to acquire fewer animals. These findings at Five Finger Ridge may be greatly substantiated with the use of isotopic data. I used three different isotopes that reflect geology, climate, and diet to help understand what was happening to local prey populations around Five Finger Ridge.
Strontium isotope ratio (Sr-87/Sr-86) values are determined by geology, thus archaeologists can use it trace organisms to locations to understand migration, trade, and other things. Oxygen isotopes correspond with temperature and precipitation, so changes in these isotopes are expected to correspond with climate change. Carbon isotopes relate to different kinds of plant photosynthesis (C3 plants versus C4 plants), with the distribution of these plants related to climate (e.g., C4 plants correspond with more tropical climates).
Teeth are particularly useful for isotope analysis for two reasons. First, they preserve exceptionally well compared to bone, which is more likely the take up strontium from the final burial context at the site. Second, teeth form sequentially during early life, unlike bone that is constantly remodeled. Thus, while bone provides an averaged isotope value, serial sampling of teeth provides more precise information regarding an animal’s life history. Since herbivores like sheep tend to have the same annual migration routes, these snapshots can be used to identify different populations. My goal here is not to identify the source of the animal at death (which would only be possibly by analyzing the strontium for the entire region), but to identify different source populations of animals.
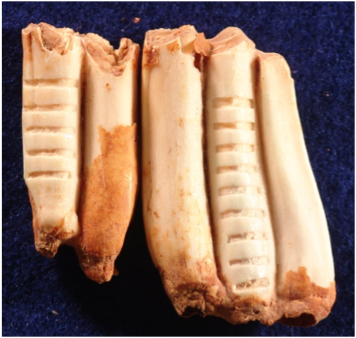
Above is an example for an individual mountain sheep. In the photo are the second (left) and third (right) lower molars, with multiple samples taken from the bottom to the top of the tooth. The top of the second molar (upper-leftmost sample) developed when the animal was relatively young (not long after birth), and the bottom of the third molar (lower-rightmost sample) developed when the animal was much older, about three years later.
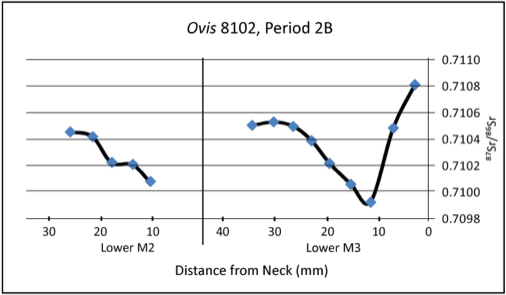
In the graph above, the strontium ratio values are plotted through time. This particular animal consumed plants from a particular region, represented by strontium ratio value of roughly 0.7105, at three points, representing three different years.
Stable Isotopes and Mountain Sheep
Last updated on October 27, 2010
Jacob Fisher takes full responsibility for the information posted. The information on this page represents that of Jacob Fisher and not that of California State University Sacramento.