A
Survey Of The Planets
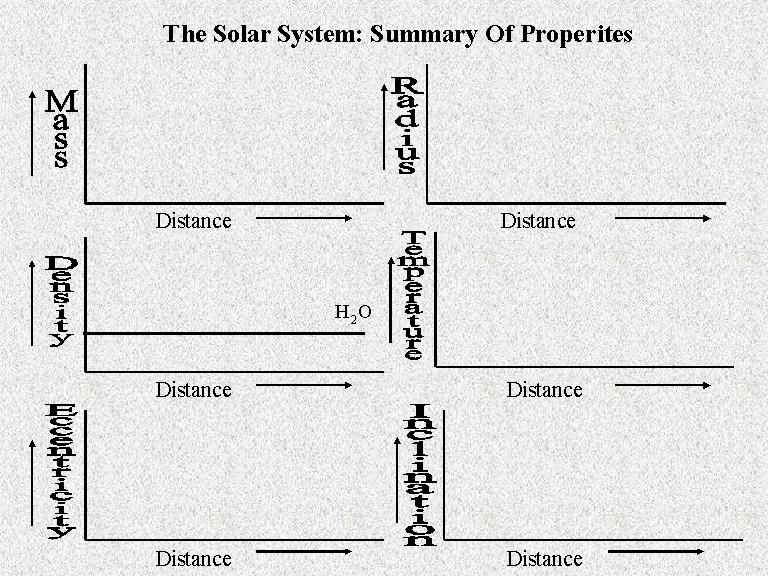
Web-based Assignment: Fill
In The Summary Graph
Using the "Summary Table" you have
filled in, plot the requested information on the following "Summary Graphs".
To do so, follow the steps:
- For the first graph (upper left hand corner), plot
the mass of each planet versus its distance from the Sun. To do so, you will have to
decide how to mark each axis so that all of the planetary data will fit. You must
also decide how to express both the mass and the distance (may I suggest mass in
comparison to the Earth, and distance in astronomical units?). The goal is to see
how mass varies as you move out in the Solar System. Does the mass of a planet
increase steadily, decrease steadily or clump in different regions of the Solar System?
- For the second graph (upper right hand corner),
plot the radius of each planet versus its distance from the Sun. To do so, you will
have to decide how to mark each axis so that all of the planetary data will fit. You
must also decide how to express both the radius and the distance (again, may I suggest
radius in comparison to the Earth, and distance in astronomical units?). The goal is
to see how radius varies as you move out in the Solar System. Does the radius of a
planet increase steadily, decrease steadily or clump in different regions of the Solar
System?
- For the third graph (middle left hand corner),
plot the density of each planet versus its distance from the Sun. Again you
must also decide how to express both the density and the distance (may I suggest density
in grams/cm3, and distance in astronomical
units?). Be sure all the data fit on the graph! The goal is to see how density
varies as you move out in the Solar System.
- For the fourth graph (middle right hand corner),
plot the temperature of each planet versus its distance from the Sun. Again, you
must also decide how to express both the temperature and the distance, and be sure that
all the planets fit on the graph. The goal is to see how temperature varies as you
move out in the Solar System.
- For the fifth graph (lower left hand corner), plot
the orbital eccentricity of each planet versus its distance from the Sun. Again, you
must also decide how to express both the eccentricity and the distance, and be sure that
all the planets fit on the graph. The goal is to see how orbital eccentricity varies
as you move out in the Solar System.
- Finally, for the fifth graph (lower right hand
corner), plot the orbital inclination of each planet versus its distance from the Sun.
The goal is to see how orbital inclination varies as you move out in the Solar
System.
After you have
plotted the data, look it over and see what overall trends become apparent for planets in
the Solar System. With a little thought, you should begin to see patterns that need
to be explained by theories of Solar System formation.
Can you devise
your own theory as to why the planetary properties are as they are?
Can you
make predictions about how other solar systems, around other stars should appear?