The Radial Velocity
Curve
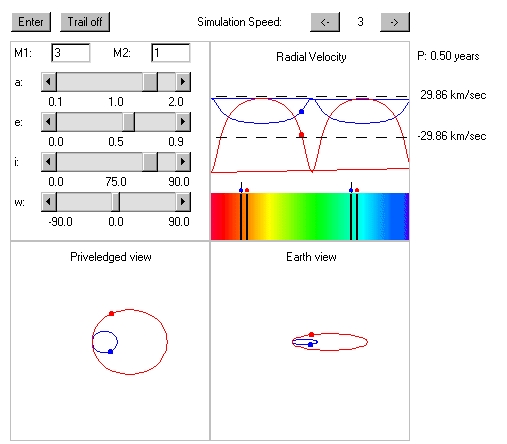
Above the rainbow-colored
portion of the screen (the spectrum) you will find plots showing the radial velocities of
the two stars, as measured from Earth. The variation in radial velocity of the blue
star over time is shown by the blue path (the blue dot indicates the radial velocity at
the moment), while the variation in radial velocity of the red star over time is shown by
the red path (the red dot indicates its radial velocity at the moment). Note that
the stars themselves are not necessarily red and blue, but that those are the chosen
colors of the dots and radial velocity curves in the diagrams! The labels
on the right reveal the period of the orbits (in years) and two radial velocities
(positive - directed away from you, and negative - directed towards you). Note how
when one star has a positive radial velocity, the other has a negative radial velocity.
This should make sense based on the orbital motion of the stars.
Please Close
This Window To Return To The Applet Page
|