Effects of Trade Liberalization on Domestic Prices: The Evidence From Korea, 1983-1995
January 1999
Yung Y. Yang(*)
Department of Economics
California State University, Sacramento
Min Hwang
Department of Economics
University of California, Berkeley
Abstract: This paper presents estimates of the competitive effect of trade liberalization on the domestic pricing behavior of Korean manufacturing, utilizing panel data for 18 manufacturing sectors at the 3 digit SIC level over five 3-year periods during 1983-1995. Theoretical framework is based on an oligopolistic model of price determination in an open economy. Our results indicate that there was a restraining effect of import competition on domestic prices in Korea. One policy implication is that trade policy should be viewed as another viable policy option to promote domestic competition.
JEL Classification: F13, F14
Key Words: Trade liberalization, Import Competition, Competition Policy
(*) Corresponding author: Department of Economics, California State University,
6000 J Street, Sacramento, CA 95819. Phone: 916) 278-6264 Fax: 916) 278-5768
E-mail: yangyy@csus.edu
Effects of Trade Liberalization on Domestic Prices: The Evidence from Korea, 1983-1995
I. Introduction
The usual channels through which trade policy reform or liberalization could bring benefits are through improved resource allocation within and across industries (static gains) and through technical change, learning, and growth leading to improved productivity growth (dynamic gains). However, there is another channel by which trade liberalization can be expected to provide major benefits to the performance of developing countries, namely through its competitive effect by fostering domestic competition on domestic pricing. If this channel were to be more widely recognized, then trade policy may be viewed as another effective policy to promote competition.
There are a few empirical studies of the effect of import competition on domestic price in the context of developed countries. However, a systematic attempt to quantify the beneficial effect of trade liberalization in developing countries is often hampered both by a lack of required data and by the difficulty of singling out the effect of trade policy reform. Yet there are two sets of empirical studies on the effect of trade liberalization on domestic prices in developing countries. The first group consists of four studies from a World Bank project, which was led and reported by James Tybout(1992) and also cited in Rodrik(1995). These studies, which are largely based on cross-section data, examined, among other things, whether or not trade liberalization had led to reduced price-cost margins in these countries. They found an affirmative answer, and this evidence may be interpreted as indirect evidence of the competitive effect of trade liberalization on domestic price. One shortcoming of these studies is that they are largely based on cross-sector data during the early and mid-1980s, thus covering only the early phase of trade liberalization experiences in developing countries. As is well known, more serious trade liberalization in developing countries started to be implemented in the mid-1980s and has continued since then through the mid-1990s. At the same time, the coverage of countries in these studies (Turkey, Cote d’Ivoire, and Mexico) is quite limited; therefore, the generality of their conclusions may be subject to question. The second group includes two other studies in a slightly different context by Corbo and McNelis (1989) and Yang and Hwang (1998). Using time-series data, these studies examined the pricing of manufactured goods during trade liberalization. While interesting, these studies examined the response of domestic prices to changes in external or import prices during the period of trade liberalization, not to trade liberalization per se. In such studies, one can at best examine if the response of domestic prices happens to coincide with the known episode of trade liberalization. However, since it is difficult to control other factors before and after the episode of trade liberalization, it is difficult to be certain of the true competitive effect of trade liberalization.
Therefore, there seems to be a need for a systematic analysis of the competitive effect of import liberalization in developing countries which pursued trade liberalization during the period from the early 1980s through the mid-1990s, the period during which more serious import liberalization has been implemented. The main objective of the present paper is to examine empirically the effect of trade liberalization on the domestic pricing behavior of Korean manufacturing, utilizing panel data for 18 manufacturing sectors at the 3 or 4 digit SIC level over five 3-year periods during 1983-1995. What follows is a brief discussion of import liberalization for Korean manufacturing to provide a perspective on evaluating our empirical results. Then we present in the next section a model of domestic price determination and import competition. After presenting the model, we examine empirically how Korean manufacturers adjust their prices to trade liberalization. In the last section, a summary and conclusions of the study are presented.
II. A Brief Review of Import Protection and Liberalization in Korea
In the early stages of economic growth during the period from mid-1960s to early 1970s, imports were severely restricted as a way of restraining chronic balance of payment deficits. In the mid-1970s, import restrictions continued while Korea built industrial structure by focusing on the development of heavy and chemical industries (HCI). During this period of HCI drive, the giant conglomerates chaebol were the beneficiaries of deliberate governments support like preferential interest rates and a high level of protection from international competition. The HCIs drive from the mid 1970s to the early 1980s made a significant contribution to the successful industrialization of the Korean economy (Westphal,1990). But the HCI drive also created some undesirable side effects, namely inefficiency resulting from the oligopolistic market structure (as indicated by its high concentration ratio) and an excessive protection of domestic industry from import competition. This led to a call for trade liberalization. However, it was not until the early 1980s that the Korean government started to seriously implement trade liberalization as a way to improve the efficiency of the Korean economy.
The import liberalization in Korea was pursued in two stages. The first phase of the import liberalization was implemented during the period from the early 1980s through 1988, and was accomplished by (1) liberalization of import licensing and (2) reduction of tariff rates. Both of these measures were intended to provide competitive pressure for domestic industries. The second phase of import liberalization was launched in 1988 and took the form of a then new five-year tariff reduction program during 1989 to 1993. During this period, a more extensive and accelerated tariff reduction program was implemented. This was partly due to the fact that the trade surplus allowed Korea to adopt a more liberal trade policy and also partly in response to increasing import liberalization pressure from the U.S. and other developed countries. As a result, the import liberalization ratio for Korea’s total imports (measured as number of items not subject to import approval over the total number of items times 100) has increased rapidly, as shown in the first column of Table 1 from 80.4% in 1983 to 98.9% in 1995. During the same period, the average Korean tariff rate for manufactures also declined gradually from 22.6% in 1983 to 9.7% in 1993, as in the second column of Table 1. It is remarkable to note that the average tariff rate in 1993 was below ten percent. As an additional check, we also calculate the average tariff revenue ratios from input-output tables and presented them in the third column of Table 1. During the period, the average tariff revenue ratio also declined from 10.6% in 1983 to 4.1% in 1995. This indicates that both the average tariff rates from customs data and the average tariff revenue ratio from the input-output tables were cut during the period by more than half of what they were in early 1980s.
While tariff reduction in Korea during the period is substantial and impressive, there are still serious visible and invisible non-tariff import barriers in Korea. According to the 1995 APEC Secretariat report, which was based on UNCTAD data, the Korean economy in 1993 was still characterized by various non-tariff barriers. This implies that while the import tariff has continued to fall substantially during the period, both visible and invisible trade barriers evidently still existed in Korea. According to another more recent study by DeRosa(1998) which is also based on UNCTAD’s data in Trade analysis and Information System, this pattern is also true in all East Asian and other developing countries. As is well known, however, data on non-tariff barriers are scarce and not available for any systematic empirical analysis. Therefore, researchers have to resort to indirect measures of non-tariff barriers.
One such measure is the import penetration ratio, which is often used as a measure of import share in studying the role of import discipline in the context of developed countries. In developing countries, however, it is reasonable to consider import penetration ratios as a measure of import liberalization. While average tariff rates or tariff revenue ratios may capture changes in actual tariff rates, import penetration ratios will probably better capture the effect of both tariff and non-tariff barriers. The last column of Table 1 presents the average import penetration ratios for Korean manufacturing, which are calculated as the weighted averages of import penetration ratios in each sector for each year, using the value of output in each sector as the weight. It is interesting to note that the average import penetration ratios started at 3.2% in 1983 and continued to decline to 1.9% through 1990. It then rose to 2.6% in 1993 and came back down to 2.0%, a level close to that in 1990.
III. The Model
Following Pugel(1980), assume a monopolist who faces competition from a
differentiated, imported product. Let ![]() and
and ![]() be demands for the domestically produced good
and for the imported good, and both are functions of prices of two goods:
be demands for the domestically produced good
and for the imported good, and both are functions of prices of two goods:
![]() ,
, ![]() ,
, ![]() (1)
(1)
![]() ,
, ![]()
![]() (2)
(2)
The first order condition for the monopolist is then,
 (3)
(3)
Rearranging (3) and letting m be the import penetration ratio, m
=![]() , yields the price charged by the
monopolist,
, yields the price charged by the
monopolist,
![]() (4)
(4)
where  and
and ![]() is the price elasticity of supply of import;
is the price elasticity of supply of import; ![]() and
and ![]() are own price elasticities of demand for the domestic good and the imported
good; finally
are own price elasticities of demand for the domestic good and the imported
good; finally ![]() and
and ![]() are the cross price elasticities, respectively. The major
implication of Equation (4) is that the effect of import competition on the domestic price
depends on the import share. Since
are the cross price elasticities, respectively. The major
implication of Equation (4) is that the effect of import competition on the domestic price
depends on the import share. Since ![]() , the
domestic price charged by the monopolist decreases as the import share increases, i.e.,
, the
domestic price charged by the monopolist decreases as the import share increases, i.e., ![]() . Equation (4), however, presents only a polar
case for the monopolist. To cover a wide range of domestic competition other than the
monopolist case, it would be reasonable to modify the model in such a way that the
price-cost margin depends on the degree of competitiveness of the given industry as well
as on the import share. Following Pugel (1980) again, we rearrange Equation (4) and add a
new variable that measures the degree of competition, S,
. Equation (4), however, presents only a polar
case for the monopolist. To cover a wide range of domestic competition other than the
monopolist case, it would be reasonable to modify the model in such a way that the
price-cost margin depends on the degree of competitiveness of the given industry as well
as on the import share. Following Pugel (1980) again, we rearrange Equation (4) and add a
new variable that measures the degree of competition, S,
 . (5)
. (5)
where ![]() . S will be
0 if the industry is perfectly competitive so that there is no margin between price and
the cost and 1 if the industry is purely monopolistic, thus reducing to (4).
. S will be
0 if the industry is perfectly competitive so that there is no margin between price and
the cost and 1 if the industry is purely monopolistic, thus reducing to (4).
Linearizing Equation (5) and substituting with measurable variables, we obtain an empirical equation for domestic price, which depends on unit costs, the import penetration ratio and the degree of competitiveness in the industry, given own price elasticities from the respective demand curves:
Pit = b0 + b1ULCit + b2UMCit + b3MDit + b4CRit + b5 IPRit (6)
where Pit denotes the domestic price of industry i at time t; ULC and UMC denote unit labor and materials costs; MD and CR denote market demand variable and concentration ratio; and IPR denotes the import penetration ratio.
In Equation (6), the effect of import competition enters the price equation independently of market structure. However, as Caves(1980) and Pugel(1980) pointed out, the effect of import competition on the domestic price (and the profit of domestic firms) is expected to be stronger in a more concentrated domestic industry. It is therefore desirable to modify Equation (6) to include an interaction term between CR and IPR. In addition, we may also wish to add another interaction variables for MD and CR to reflect a possibility that the effect of market demand change is greater when the industry is less competitive, given the production cost. Thus the estimating equation (6) becomes
Pit = b0 + b1ULCit + b2UMCit + b3MDit + b4 CRit + b5 IPRit + b6 CR� IPR + b7 CR� MD (7)
b0, b1, b2, b3 > 0; b5, b6 < 0
Equation (7) will be estimated first by OLS. Since the equation (7) contains MDit and IPRit, which might be determined endogenously with the domestic price in a simultaneous system, which includes the equation (1) and (2), it may be necessary to estimate it by 2SLS. Following DeRosa and Goldstein(1981), we adopt domestic consumption expenditure and the domestic-import price ratio as instruments for 2 SLS.
IV. Empirical Analysis
A. Data
The dependent variable Pit is the Korea’s annual producer price index of industry i in year t. The data for domestic prices for 1983, 1985, 1988, 1990, 1993, and 1995 across 18 sectors come from the Bank of Korea’s Price Statistics. These data provide a detailed and consistent series for 1981 to 1993 and the data for 1995 was obtained from March 1996 issue of Bank of Korea’s Monthly Statistical Bulletin. Since the data for ULCit are not available, they are constructed following a method originally used by Hooper and Mann(1989), utilizing data on earnings, man days, employment, and an industrial production index in each sector. The data for UMCit are calculated as weighted averages of Producer Price Indexes for energy, raw materials, and intermediate materials, using relative importance as weights. The market demand in each sector, MDit, is measured by the ratio of inventories to shipments in each sector. While several other potential measures of the market demand are possible (such as the inventory, change in real output, and total expenditure on domestic and imported goods, deflated by the price of domestic goods), none of these measures of market demand are found to be useful.
The data on concentration CRit are the three-firm concentration ratios at three digit SIC level and obtained from Kang (1995). Unfortunately the concentration ratios for various industries are available only for 1983, 1985, 1988, and 1990, and no comparable data for the years 1993 and 1995 are available. One possible choice is to use the average concentration ratios for all years, as Lee(1997) did. In this case, we only allow variation in concentration ratios across industries, but not over time. Another possibility is to use the actual concentration ratios for the 1983-90 period and assume that concentration ratios remain the same for the first half of 1990s. Since there is no a priori basis to prefer one set of data to the other, we use both sets of concentration ratio data.
Import penetration ratio (IPR) and tariff revenue ratio (TRF) are calculated from the transaction table at producers prices of the input-output tables for the years available from 1983 through 1995. Extra care was taken to develop consistent series for IPR and TRF in the face of minor changes in classification categories in the IO tables as the Korean economy matured over time. Furthermore, extra care was also taken to make sure that series for IPR and TRF obtained from the input-output tables are matched with the price data obtained from the Bank of Korea. Fortunately, both the input-output tables and price statistics are published by the Bank of Korea and the entries are very similar and easily comparable. Therefore, it is reasonable to expect that domestic prices and the associated IPR and TRF are consistent.
B. Regression Results:
Before we proceed, two points need to be kept in mind. First, since all variables are in natural logarithms, the estimated coefficients may thus be interpreted as elasticities. Second, faced with missing data for 3-firm concentration ratios for 1993 and 1995, as noted earlier, estimation was carried out by using the two sets of concentration ratios data. Regression results obtained from using the two sets of concentration ratios turn out to be very similar, and thus we present only the regression results obtained from using the concentration ratios of the second method. This implies that we do not lose much explanatory power even when we use the average concentration ratios.
Regression results in the first two columns of Table 2 present estimation of domestic price in terms of traditional domestic variables only, namely costs of production, market demand and concentration ratio. In general, the coefficients for the unit labor cost (ULC) and unit material cost (UMC) are quite high and significant at 1% level, as expected. The sum of the two coefficients is very close to 0.7, indicating the predominant role of the two domestic cost variables in explaining domestic price. Individually, the coefficient for ULC ranges from 0.158 to 0.189, while the coefficient for UMC ranges from 0.517 to 0.562. It is interesting to note that the slightly more than half of the changes in material costs are passed on as higher domestic prices. In contrast, only 16 to 19 percent of changes in unit labor costs are passed on as higher domestic prices. The coefficients for the demand variable and the concentration ratios are both small and insignificant, indicating that these two variables do not seem to have much explanatory value.
However, adding the import penetration ratio (IPR) as an explanatory variable in explaining the domestic price equation substantially improves the estimation results. Note that the estimated coefficient for IPR, - 0.143, is of expected negative sign and highly significant and its magnitude is quite high, indicating that a ten percent increase in IPR leads on average to a reduction of domestic price by 1.43 percent. This clearly demonstrates a substantial restraining effect of import competition on domestic price behavior by itself. Replacing the import penetration ratio (IPR) with the average tariff revenue ratio (TRF) in the estimation of domestic price, as shown in fourth column, actually results in poorer regression results. This illustrates that the tariff variable alone as a measure of trade policy change does not have much explanatory power in explaining domestic prices. When we used both IPR and TRF together in regression (5) in Table 2, we find that this regression provides the best results thus far. The highly significant IPR coefficient of expected negative sign turns out to be -0.166 and the also significant TRF coefficient is 0.029. The positive and significant coefficient for TRF, 0.029, indicates that that ten percent increase in the tariff revenue ratio results in roughly a 0.3 percent increase in domestic price on average. It also appears that the tariff revenue ratio seems to have some explanatory power in explaining the domestic price.
We then permit the dampening effect of import on domestic prices to depend on the industry’s market structure by allowing the import penetration ratio to interact with the three-firm concentration ratio in the industry (CR*IPR). If, as hypothesized, the effect of import competition on domestic price is greater than in more concentrated industries, the estimated coefficient on CR*IPR should be negative and significant. In the same equation, we also allow the effect of industry demand on prices to interact with the industry concentration ratio (CR*MD) to test whether or not a given change in market demand has a different effect on domestic prices in concentrated industries. As before, the equations were estimated by OLS and the result is that the use of any of these interaction variables do not improve the regression results, as shown in the sixth and seventh columns. On the surface, it appears that the influence of import competition did not enter interactively with seller concentration. However, one should be reminded that these regression results may be subject to simultaneous equation bias because they ignore any simultaneity between domestic price and the explanatory variables.
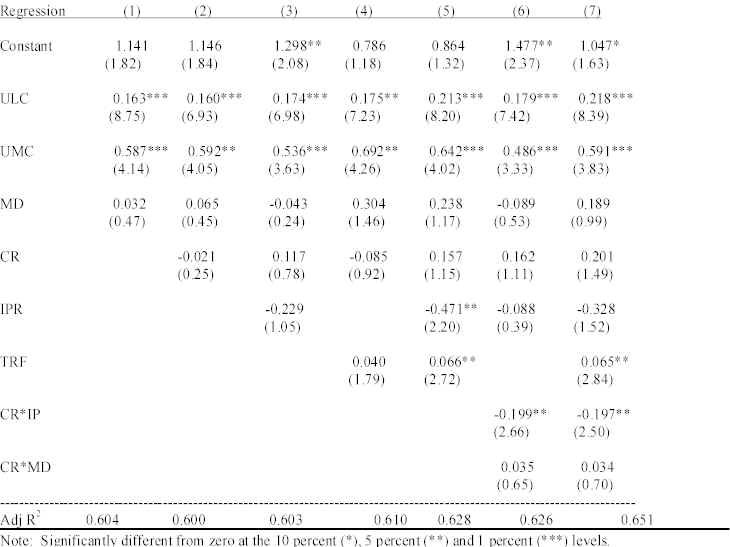
The next question to be addressed is how the estimates of the effect of trade policy changes might be altered if the simultaneity between domestic prices, on the one hand, and import penetration ratio and demand for the industry, on the other hand, were accounted for. It is quite possible that OLS estimates of the effect of trade policy change may be understated under plausible assumptions. Table 3 presents the regression results based on the two-stage least squares. As noted earlier, we adopt domestic consumption expenditure and the domestic-import price ratio as instruments for 2SLS. Examining the regression results in Table 3, we find that they are similar to those in Table 2 based on OLS in terms of the magnitude, sign of coefficients, and overall fit. However, there are two important differences to be noted. First, the 2SLS estimates in Table 3 are in general slightly higher than the corresponding OLS estimates in Table 2, as expected. For instance, the 2SLS coefficients for ULC and UMC in the first column of Table 3, 0.163 and 0.587, are slightly higher than the corresponding OLS estimates of 0.158 and 0.540 in Table 2. The same pattern holds true with the rest of regressions in Tables 2 and 3. This shows that when a two-way causation among domestic price, on the one hand, and MD and IPR, on the other hand, is recognized, domestic price shows a slightly greater response to changes in explanatory variables. This finding is consistent with earlier studies that 2SLS estimates are higher than corresponding OLS estimates. However, comparison of the coefficients in Tables 2 and 3 indicate that the extent of simultaneous equation bias is considerable. Second, in contrast to OLS estimates in Table 2, the estimated coefficient from 2SLS for the interaction term CR*IPR in Table 3 is of expected negative sign and highly significant at one percent, as shown in Regressions (6) and (7) in Table 3. However, the estimated coefficient for the second interaction variable CR� MD is of expected positive sign but its statistical significance is rather weak.
Findings in Tables 2 and 3 provide several useful pieces of information about the role of IPR and TRF in the determination of domestic price. First, the inclusion of both import penetration ratio(IPR) and tariff revenue ratio(TRF) seems justified in the specification of domestic price, because while TRF may capture the effect of tariff reduction, IPR would probably capture the overall effect of both tariff reduction and non-tariff barriers. As long as direct data on non-tariff barriers are not available, the inclusion of both IPR and TRF may be necessary to capture the effect of overall trade policy changes. When IPR and TRF are used with no interaction variables, the magnitude of restraining effect of import competition seems to be the largest, as evidenced by high IPR coefficient -0.471 in Regression (5) of Table 3. Second, the use of an interaction variable, especially the interaction variable between the seller concentration ratio and import penetration ratio, seems to be justified and our finding is consistent with the earlier findings by Pugel(1980) and DeRosa and Goldstein(1981) that import competition on domestic price has a greater effect in the most highly concentrated industries. Regression (7) of Table 3 shows that the restraining effect of import competition in concentrated industries is -0.525, the sum of IPR coefficient of -0.328 and CR*IPR coefficient of -0.197, clearly demonstrating that the restraining effect of import competition is substantially greater in concentrated industries. Third and finally, it is necessary to account for simultaneity between domestic price and the explanatory variable in examining the effect of trade policy changes on domestic price. The magnitude of simultaneous equation bias appears to be substantial in our regression results. Comparing estimated coefficients for ULC and UMC in Regression (5) of Table 2 with those corresponding coefficients in Table 3, we find that 2SLS coefficients are 15 and to 17 percent larger, respectively, than the corresponding OLS estimates. Likewise the comparison of the estimated coefficient for IPR shows that 2SLS estimate of -0.471 estimate is substantially larger than the OLS estimate of -0.166.
V. Conclusion
In this paper, we attempt to estimate the competitive effect of trade liberalization using the case of Korean manufacturing. The estimation is based on panel data for 18 manufacturing sectors at the 3 or 4 digit SIC level over five 3-year periods during 1983-1995. We have used both OLS and 2SLS to estimate the response of domestic prices to changes in two presumed explanatory variables for trade policy change, namely the import penetration ratio and the tariff revenue ratio. In our estimation, we also allowed the effect of import penetration ratio and market demand to interact with three-firm concentration ratio in the industry.
Our results suggest that there was a negative and thus restraining effect of import competition on the domestic prices in the Korean manufacturing sector. Thus it is clear that import competition not only affects profit rates in developing countries [see the World Bank studies reported by Tybout(1992)] but price behavior as well. Comparing our results with the earlier findings on the disciplinary effect of imports on domestic prices [Pugel(1980), Marvel(1980), and DeRosa and Goldstein(1992)], the restraining effect in Korean manufacturing appears to be substantially larger than those in U.S. manufacturing. Considering that manufacturing sectors in many developing countries, including Korea, are in general characterized by high concentration and market power and that their domestic markets have been heavily protected by various import restrictions, it is not surprising to find a larger effect of trade policy change on domestic price. Our results indicate that a ten percent increase in the import penetration ratio will, in general, lower the domestic price on average by 3 or 4 percent. In addition, the dampening effect of import competition appears to depend on the market structure of the industry. In general, the dampening effect of import competition is stronger in concentrated industries than in less concentrated industries. Our results also indicate that it is desirable to include both the import penetration ratio and the tariff rate as measures of trade liberalization. While the import penetration ratio outperforms the tariff revenue ratio in explaining domestic price, it seems reasonable to include the average tariff revenue ratio as long as it has aditional explanatory power. Finally, the estimated effect of trade policy changes on domestic prices is reasonably robust over different specifications and methods of estimation. When the simultaneity between domestic price and the explanatory variables exists, the 2SLS estimates of the trade policy effect on domestic price appear to be somewhat larger than those from corresponding OLS estimates.
One important policy implication of this finding is that trade liberalization should be viewed as another viable policy to promote domestic competition. An ideal competition policy in developing countries should then consist of vigorous enforcement of domestic competition policy in the form of regulatory reform and antitrust policy as well as an earnest pursuit of trade liberalization. Given the complementary nature of their two policies, it is essential for them to work together to bring the maximum benefit to the economic performance of developing countries.
Table 1.� Indicators of Import Liberalization in Korea, 1983-1995
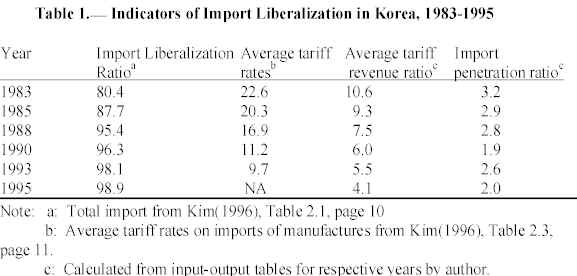
Table 2.� Estimation of Domestic Price, 1983-1995, Using OLS
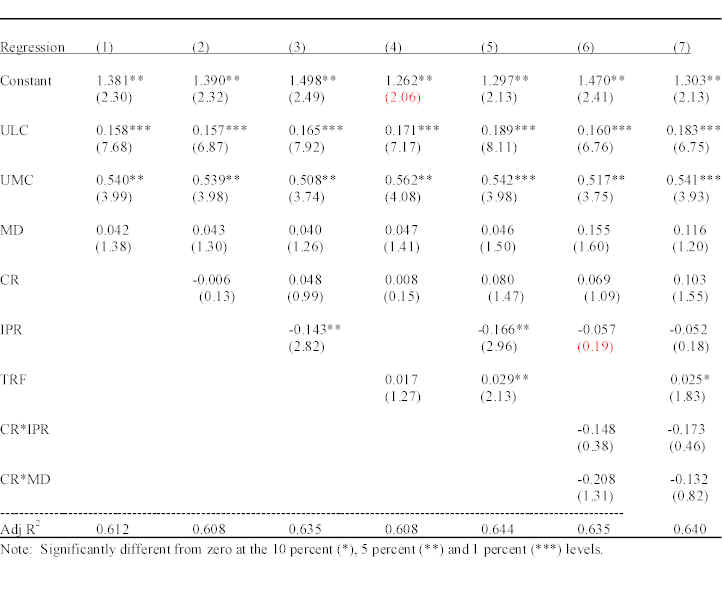
Table 3.� Estimation of Domestic Price, 1983-1995, Using 2SLS
REFERENCES
APEC Secretariat. Survey Impediments to Trade and Investment in the APEC Region.
1995 report by the Pacific Economic council for APEC, Singapore: APEC Secretariat.
Caves, Richard E., "Industrial Trade and Industrial Organization: Introduction", Journal
of Industrial Economics, Vol. 24, No. 2, December 1980, 113-17.
Ceglowsky, Janet, "Dollar Import Prices and Domestic Prices in the 1980s: A Simultaneous Equation Approach," Bryn Bawr mimeo, December 1992.
Corbo, Vittorio and Paul D. McNelis, "The Pricing of Manufactured Goods During rade
Liberalization: Evidence From Chile, Israel, and Korea," The Review of Economics and Statistics, 1989, pp. 491-499.
DeRosa, Dean A., "Outward-Oriented Policies in Asia in the Aftermath of the 1997/98 Currency
Crisis: Foreign Trade and Investment Policies," a mimeo, October 1998.
DeRosa, Dean A. and Morris Goldstein, "Import Discipline in the U.S. Manufacturing,"
International Monetary Fund Staff Papers, September 1981, pp. 600-34.
Dornbush, Rudiger, "The Case for Trade Liberalization in Developing countries," The Journal of Economic Perspectives, Vol. 6, No. 1, Winter 1992, 69-85.
Foroutan, F., "Foreign Trade and Its Relation to Competition and Productivity in Turkish
Industry," June 1992, The World Bank.
Grether, J.M., "Trade Liberalization, Market Structure and Performance in Mexican
Manufacturing: 1984-1989," 1992, mimeo.
Harrison, A., "Productivity, Imperfect Competition and Trade Liberalization in Cote
d’Ivoire’, World Bank Working Paper WPS 451, July 1990.
Hong, Wontack, "Import Restriction and Liberalization," in Liberalization in the
Process of Economic Development, ed. By Lawrence B. Krause and Kim Kihwan, University of California Press, Berkeley, 1991.
Jeong, Kap-Young and Robert T. Masson, "Market Structure, Entry, and Performance in
in Korea," The Review of Economics and Statistics, 1990, pp. 455-62.
Kang, Nam-Hoon, Domestic Competition, Industrial Efficiency and Trade Liberalization
in Korean Industries, a Ph. D. thesis submitted to the University of Michigan, 995.
Kim, Namdoo, Measuring the Costs of Visible Protection in Korea, Institute for
International Economics and Korea Institute for International Economic Policy, November 1996.
Krishna, Pravin and Devashish Mitra, "Trade Liberalization, market discipline and productivity growth: new evidence from India," Journal of Development Economics, Vol. 56(2), pp.447-462.
Lee, Jae Hyung, "The Current Picture and Performance of Korean Business Groups
(Jaebol)," a Ph. D. thesis, submitted to Sung Kyun Kwan Univesity, 1997.(in Korean)
Lee, Jae Woo, "The Response of Exchange Rate Pass-Through to Market Concentration
in a Small Economy: The Evidence from Korea," The Review of Economics and Statistics, February 1997, pp. 142-5.
Levinsohn, James, "Testing the imports-as-market-discipline hypothesis", Journal of
International Economics, Vol. 35 (1993), pp. 1-22.
Pugel, Thomas A., "Foreign Trade and US Market Performance," Journal of Industrial
Economics, Vol. 29 (December 1980), pp. 119-29.
Rodrik, Dani, "Trade and Industrial Policy Reform," in Handbook of Development
Economics, Vol. III, ed. By J. Behrman and T.N. Srinivasan, Elsevier Science
B.V., 1995.
Swagel, Phillip, "Import Prices and the Competing Goods Effect," mimeo, Northwestern
University, April 1996.
Tybout, J. R., "Linking Trade and Productivity," The World Bank Economic Review,
Vol. 6, 1992, pp. 189-211.
Westphal, Larry E, "Industrial Policy in an Export-Propelled Economy: Lessons from South Korea’s Experience," Journal of Economic Perspective, Vol. 4, pp. 41-59.
Yang, Yung Y. and Min Hwang, "Price Behavior in Korean Manufacturing," The Review
of Economics and Statistics, August 1994, pp. 461-70.
___________________, "The Pricing Behavior of Korean Manufactured Goods During Trade Liberalization," Journal of Policy Modeling (forthcoming).