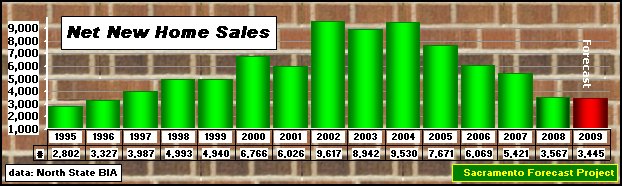
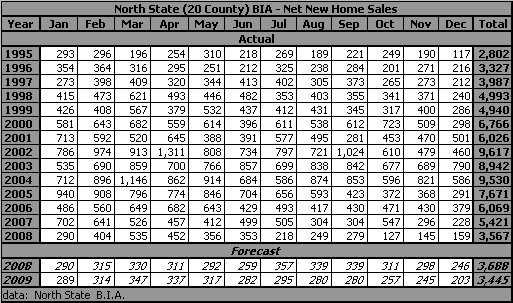
| Sacramento Forecast Project | Sacramento Metropolitan Statistical Area Economic Forecast | California State University, Sacramento |
| revised January, 2008 | ||
| Unemployment | Fountain Predictor | Earnings | Taxable Sales | Transportation | Residential Construction | Data Tables | Resources | SFP Page | ||
| Employment |
| 1/31/2008: Job Growth for the Sacramento (4 County) MSA in 2007 was slower when compared to 2006, with 15,000 new jobs (1.65% increase) compared to 19,700 new jobs (2.21% increase). The forecast for 2008, based on actual data through December, 2007, is for an even slower 0.16% (1,500 jobs) increase. The 4 county Sacramento Metropolitan Statistical Area population continues to grow - see Vital Statistics for details. Government employment is still a major part of the workforce in the Sacramento MSA. Government Employment provides more details on that sector in the Sacramento MSA. |
![]() |

| Unemployment |
| 1/31/2008: The average annual Unemployment Rate for the Sacramento (4 County) MSA in 2007 was 5.3%, up from the 4.7% rate in 2006. The forecast for 2008, based on actual data through December, 2007, is for the average annual rate to increase to 5.7%. |
![]() |

| Fountain Predictor | |
| 1/31/2008: The Fountain Predictor for the 4 county Sacramento MSA turned negative (-0.257) in December, 2006, after 32 months of positive and stayed negative through December, 2007, except for a wimpy 0.008% positive in March. The negative values generally increased as the year progressed, ending with a -1.556% - the largest negative since the end of 1992. The negative value was the result of the Labor Force increasing by only 0.95% while the Number of Persons Employed declined by -0.606%. | |
![]() |
|
| The Fountain Predictor was named for Robert J. Fountain (Professor Emeritus, California State University, Sacramento) who suggested graphically comparing the twelve month percentage change in the Number of Persons Employed with the twelve month percentage change in the Civilian Labor Force as a measure of the economic health of an area. | The theory suggests that as long as the percentage change in the Number of Persons Employed is larger than (above) the percentage change in the Civilian Labor Force, for that area, that area is in good economic health. |

| Average Weekly Earnings, Manufacturing |
| 1/31/2008: The Average Weekly Earnings for Manufacturing workers in the Sacramento MSA soared to a new high of $690.70 in 2007, an increase of $29.00 (4.4%), from the 2006 value of $661.70. The forecast for 2008, based on actual data through December, is for a 1.2% ($8.20) increase in the annual average weekly earnings for manufacturing workers to $698.90. |
![]() |

| Taxable Sales |
| 1/31/2008: Taxable sales, all Outlets in the 4 county MSA grew at a 0.95% ($0.3 billion) rate in 2006, down considerably from the stronger 6.8% increase in 2005. The forecast for 2007 based on actual data through the 4th quarter, 2006, is a slightly slower 3.3% ($1.1 billion) increase. The forecast for 2007 is an even slower 0.25% ($0.1 billion) increase, followed by a slightly better 3.3% ($1.1 billion) increase in 2008. One of the main components in taxable sales is the market for new automobiles. |
![]() |

| Sacramento International Airport |
| 1/31/2008: The Sacramento International Airport broke through the 10 million passenger mark in 2005 and continued the pattern of new highs in 2007, with a 3.9% increase which was stronger than the 1.6% increase in 2006. The forecast for 2008, based on actual data through December, 2007, is for a stronger 6.2% (663,000 person) increase to 11.4 million passengers. |
![]() |
| 1/31/2008: The quantity of freight handled at the county's airports increased 20.7% in 2007, up 56.8 million pounds from the weight handled in 2006. The forecast for 2008, based on actual data through December, 2007, is a slower increase of 3.5% (11.8 million pounds) to 343.4 million pounds. |
![]() |
| Net New Home Sales |
| 2/7/2008: BIA has just released the January 2008 numbers and they had a major impact on the forecast for 2008 - turned the Average Net Sales to negative and lowered the annual expectations considerably. The forecast for 2008, using actual January data, is a decline to a total of 3,219 homes expected to be sold in 2008, a 40.6% decrease from 2007, and 1,550 homes less than I predicted last month. 1/31/2008: Net New Home Sales in the Sacramento area, as measured by the North State BIA declined again in 2007 - declined from 6,069 sales in 2006 to 5,421 sales in 2007 (-10.7%). The forecast for 2008, based on actual data through December, 2007, is for a slightly higher decline, -12.0%, to 4,769 sales. These are total numbers for the 20 county area - see below for an alternative. |
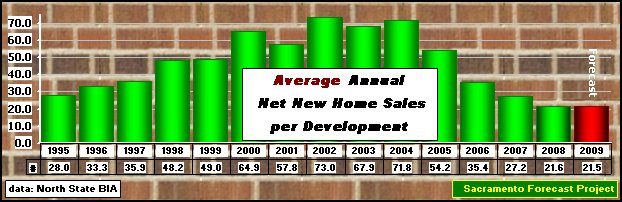
![]() |
| 1/31/2008: The success of the Sacramento-based Building Industry Association has resulted in an expansion of the territory covered by the organization. This expansion carries with it a problem of data consistency (does the growth come from expanding demand or expanding membership?). The graph above exhibits this problem and, in an effort to deal with the situation, I introduced a new series called Average Net New Home Sales. BIA reports both the Net New Home Sales and the Number of Reporting New Home Communities. Combining these two variables results in the average net new home sales per reporting community and reflects demand change without the membership change. The pattern of the new series (graph below) is similar to the old pattern and still shows the 2005 decline from an average of 72 net new home sales per reporting community to 54 sales (-24.5% ) and another decline of (-34.6% ) to an average of 35.4 net new home sales per reporting community in 2006. The 2007 decline was even larger percentage-wise -23.4% in 2007 than the total decline. The forecast for 2008, assuming no change in the number of reporting communities in 2008 and based on data through January, 2008, is for 15.3 net new home sales per reporting community. |
![]() |
| Residential Building Permits |
| 1/31/2008: Housing Units Authorized by Building Permits in the Sacramento (4 county) MSA in 2007 is expected to continue the decline that began in 2004 with a -32.6% decline from the 2006 level which, in turn was down an even larger 34.6% from 2005. All told, the decline from the peak of 23.08 thousand permits in 2003 to the projected 2007 level of 8.11 thousand permits is a 65% decline. The 2007 level will be slightly below the 1995 level. The forecast for 2008, based on actual data through November, 2007, is for a smaller decline of 29.9% to 5,680 permits issued. |
![]() |

| Data Tables |
| The Sacramento Forecast Project maintains several files of Sacramento MSA data, in Excel format, that can be made available on request. |
Employment |
![]() |
![]() |
![]() |
Taxable Sales |
|
Transportation |
|
|
Residential Construction |
|
|
| Resources |
For information about the Metropolitan Statistical Area and its business environment, try
Data Providers: |
| More on Employment |
| The California Employment Development Department's Labor Market Information Section provides definitions and descriptions of |
| Back to Sacramento Forecast Project Update: January, 2008 Next Revision: July, 2008 URL: http://www.csus.edu/indiv/j/jensena/sfp/sa11/sac5/sac3/sac-msa.htm Arthur N. Jensen, Emeritus Professor of Marketing e-mail to: jensena@csus.edu College of Business Administration California State University, Sacramento Disclaimer: Professor Arthur N. Jensen takes full responsibility for the information posted. The information on this page represents that of Professor Arthur N. Jensen and not that of California State University, Sacramento. [as required in PM BA 96-13 Policy on CSUSInfo World Wide Web] |