| Sacramento Forecast Project | Nonfarm Employment in the United States | California State University, Sacramento |
| revised January, 2009 | ||
| United States Forecast Page | ||
|
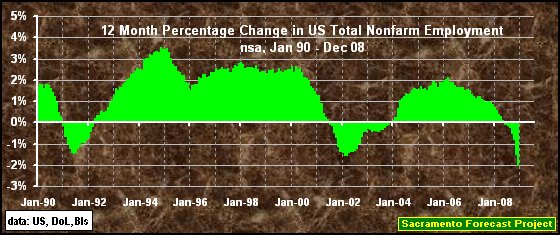
| The indicator, 12-month percentage change in US Total Nonfarm Employment, turned positive in December, 2003, and lasted for 54 months, ending in May-08. The negative pattern that began in Jun-08 is seven months old and has already gotten more negative than any negative pattern back to Dec-82. Given that the last complete negative pattern was the longest in over 50 years and this one is dropping so quickly after such a short positive pattern does not bode well for short-term economic health. |
|
|
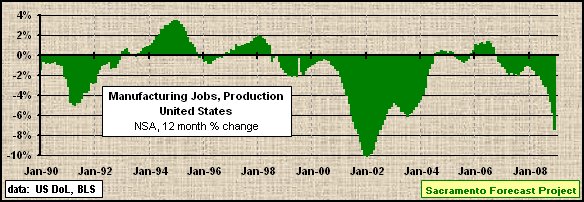
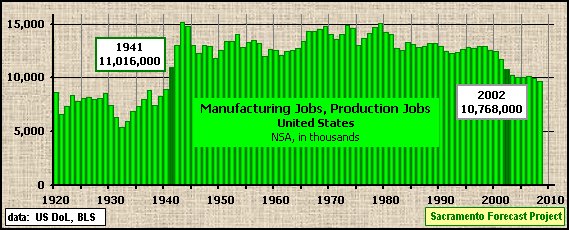
| The graphs above and below shows the 12 month percentage change in the Manufacturing Sector (just production jobs) employment that turned negative in December 2006, stayed negative through out 2007 and 2008 and is accelerating towards the previous low level reached in Jan-02. The pattern similarity between the beginning of the current negative pattern and the beginning of the previous negative pattern [the longest negative pattern (72 months) inthe last 90 years] is striking. |
|
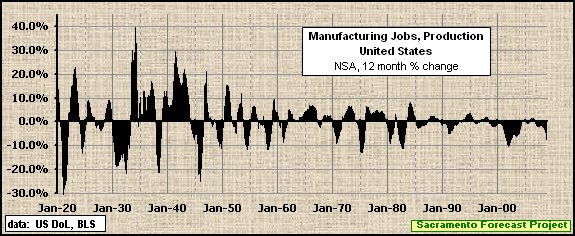
| The cumulative effect of all the increases and decreases in the number of production jobs in manufacturing over the last 88 years is that the number of production jobs in Manufacturing in the United States has declined to the point where there were 248,000 FEWER production jobs in the Manufacturing sector in 2002 than there were in 1941, and the decline continued in 2003 with another 579,000 jobs lost and again in 2004 with a loss of 117,000 jobs, and -12,000 jobs in 2005 before showing a gain (77,000 jobs) in 2006, but losing 158,000 jobs in 2007 and 315,000 more in 2008 which ended with a total of 9,214,000 production jobs in manufacturing (which is 1.8 million jobs less than the 1941 average). | |
|
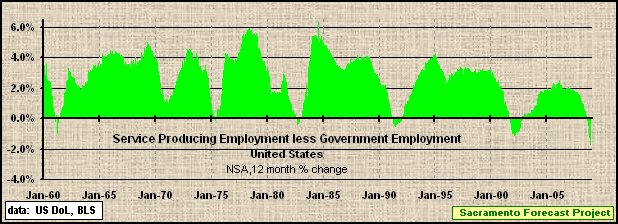
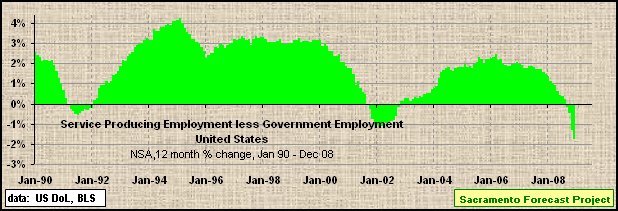
| The optimist could say that it is a good thing that Manufacturing employment is less than 16% of our total employment base and that we have become a service economy. The Service-Providing Employment Sector (minus Government Employment) turned positive in September, 2002 and stayed positive for 70 months, ending in August, 2008. The current negative pattern which began in September, 2008 and is 4 months old has already dropped below the previous negative level reached in February, 2002 and the most negative level reached in the last 50 years - not a good sign for economic well-being. |
|
|
Back to United States Forecast Page Update: January, 2009 Next Revision: July, 2009 Arthur N. Jensen, Emeritus Professor of Marketing a.jensen@comcast.net California State University, Sacramento Disclaimer: Professor Arthur N. Jensen takes full responsibility for the information posted. The information on this page represents that of Professor Arthur N. Jensen and not that of California State University, Sacramento. [as required in PM BA 96-13 Policy on CSUSInfo World Wide Web] |