-
Differences Between Discrete and Continuous Random Variables
- You have been introduced to one example of a discrete random variable,
the binomial random variable. Recall that a discrete random variable
can only assume a finite number of values. For example, the count of the number of
heads in 10
tosses of a fair coin is a binomial random variable. The only
possible value that this count can be is one of the integers 0, 1,
2, ... , or 10. Click here to
open an Excel spreadsheet, select the binomial10p tab at the bottom and
see a binomial probability distribution.
On the other hand, if you are clocking the time that it
takes someone to complete a 100 meter run, the time can be any number
between 0 and 60 seconds, for example, depending on the speed of the
runner and the precision of the clock that is recording the time of the
run. Think of discrete random variables as counts and continuous
random variables as measurements.
- Discrete random variables usually have only a finite number of
possible values while continuous random variables have an infinite
number of possible values.
- You find probabilities for discrete random variables by adding
probabilities. You can picture finding probabilities for
continuous random variables as finding areas under the probability density function.
- For discrete random variables, some numbers have nonzero
probabilities while for continuous random variables no number has
nonzero probability.
-
The Standard Normal Random Variable
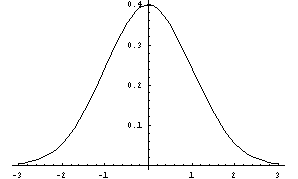
- Has mean of 0 and standard deviation of 1.
- Bell shaped as shown in the next graph--note that most of the area is
between -3 and 3. This means that a standard normal random
variable is likely to take a value between -3 and 3.

-
Nonstandard Normal Random Variables
- A normal random variable that doesn't have both a mean of zero and standard
deviation of 1 is said to be a nonstandard normal random variable
- To find probabilities associated with a nonstandard normal random
variable, a conversion to a standard normal is used. If X is a
normal random variable with a mean of m and a standard deviation of s,
then z=(X-m)/s is a standard normal random variable. To find the
probability P[x1 < X < x2] where x1 and x2 are any two numbers,
compute z1=(x1-m)/s and z2=(x2-m)/s, and find P[z1 < Z < z2] from
a standard normal random variable table. There are also
calculators that will give probabilities for a nonstandard normal random
variable. Here is a link
to a probability calculator for a nonstandard normal random variable.
- Most normal random variables that you will deal with will be nonstandard
normal random variables.
|
