Real Growth
| Sacramento Forecast Project | Economic Forecast for the United States | California State University, Sacramento |
| revising January, 2009 | ||
| Real Growth | Unemployment | Inflation | Resources | SFP Page | ||
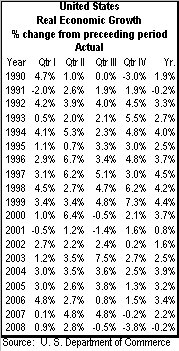
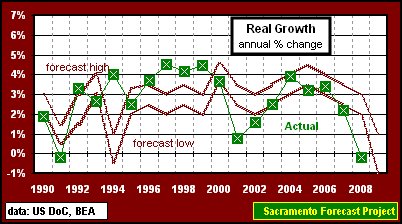
Real Growth | |
| 1/31/2009: The advance results for the 4th quarter of 2008 are in and the "doom-sayers" got their wish. The economy declined for the second quarter in a row, with the Advance value (there are at least two revisions due in the next two months) for the 4th quarter at -3.8%. You have to go all the way back to the 1st quarter of 1982 to find a larger decline - that was at the bottom of the early eighties recession. This is far from the end of the current economic troubles. My tentative forecast for 2009 marks a first - this is the first time in 30 years that I set a negative forecast value - a low for the year of -1.0. Ever the optimist, I've set the high at +1.0, which increases my forecast range to two percentage points. I definitely will revisit the range in the July update. | |
|
|

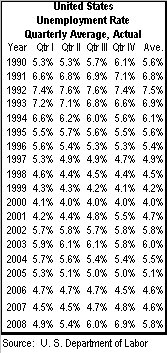
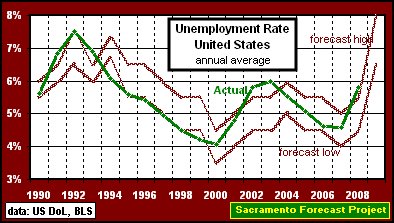
Unemployment Rate | |
| 1/17/2009: The Annual Average Unemployment Rate for the U.S. was 5.8% in 2008, just above the 4.5% to 5.5% range that I set last January. The rate rose continually throughout the year, ending with a December value of 7.2%, 2.3 percentage points above the 4.9% rate in December of 2007. The current economic climate does not provide any hope for a reduction of the unemployment rate in the near term and bad news keeps bubbling up so I'm tentatively setting the range for the ANNUAL Average Unemployment Rate to between 6.5% and 8.0% for 2009. It is tentative and I may well revise it in July (or more frequently as the year progresses). For a historical perspective of the Unemployment Rate, here's a graph of the last fifty-eight years. Additional Employment indicators: shift from goods producing jobs to service producing jobs Fountain Predictor Monthly Nonfarm Employment. |
|
 |
 |
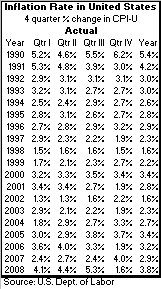
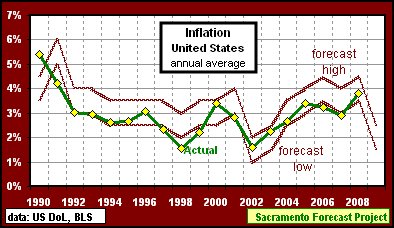
Inflation | |
| 1/17/2009: The annual Inflation Rate, as measured by the percentage change in the Consumer Price Index (CPI-U) for 2008 ended up at 3.8%, right in the 3.5% to 4.5% range I forecast in January, 2008. It was a volatile year for the CPI, with the monthly values ranging from 5.8% (Jul-08 compared to Jul-07) to 0.09% (Dec-08 compared to Dec-07) reflecting the dramatic swing in the price for petroleum and the financial problems in the economy. There are inflationary forces present in the support actions of the federal govermnent but I don't expect them to surface during this coming year, so I've set the range for the annual rate of inflation in 2009 at between 1.5% and 2.5%. Check out Inflation: 1915 to Present for a historical perspective of the Consumer Price Index, CPI-U. |
|
 |
 |
Resources | ||
|
Want another forecast... Checkout the UCLA - Anderson Business Forecast. Check the past forecasts: The complete record is in Table form, or view the graphs of Real Growth, Unemployment, and Inflation. The Sacramento Forecast Project maintains several databases, in Excel format, that can be made available on request. |
||
|
Back to Sacramento Forecast Project Revised: January, 2009 Next Revision: July, 2009 Arthur N. Jensen, Emeritus Professor of Marketing e-mail to: a.jensen@comcast.net Disclaimer: Professor Arthur N. Jensen takes full responsibility for the information posted. The information on this page represents that of Professor Arthur N. Jensen and not that of California State University, Sacramento. [as required in PM BA 96-13 Policy on CSUSInfo World Wide Web] |