| Sacramento Forecast Project | Fountain Predictor for U.S. Employment | California State University, Sacramento |
| revised January, 2009 |
| |
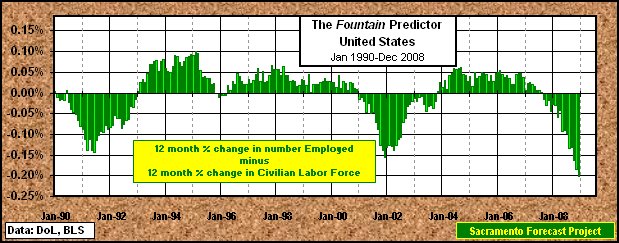
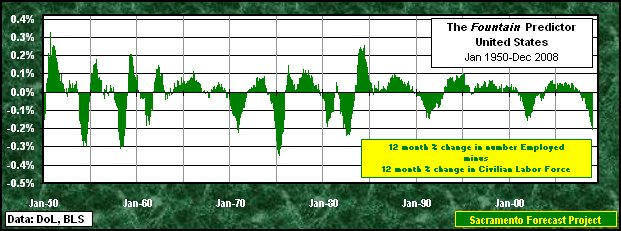
| The predictor registered 46 positive months, from the previous negative 34 month span that ended in October, 2003, through August of 2007. The positive pattern drifted close to the 0.0% line several times in 2007 before turning negative in September. The negative pattern got more negative as 2008 progressed, ending with a -0.202 in December - the 16th month of the negative span. The Labor Force component has continued to increase (an average of 0.068%) over the 16 months while the number of employed has declined over much of the time period (an average of -0.017%). The negative value of the Predictor has exceeded the negative reached during the last negative span (-0.157 in Dec-01) and is close to the -0.236 reached in Jul-82. | |
|
|
| The Fountain Predictor was named for Robert J. Fountain (Professor Emeritus, California State University, Sacramento) who suggested graphically comparing the twelve month percentage change in the Number of Persons Employed with the twelve month percentage change in the Civilian Labor Force as a measure the economic health of an area. | The theory suggests that as long as the percentage change in the Number of Persons Employed is larger than (above) the percentage change in the Civilian Labor Force, for that area, that area is in good economic health. |
|
Back to United States Forecast Page Update: January, 2009 Next Revision: July, 2009 or sooner Arthur N. Jensen, Professor Emeritus of Marketing e-mail to: a.jensen@comcast.net Disclaimer: Professor Arthur N. Jensen takes full responsibility for the information posted. The information on this page represents that of Professor Arthur N. Jensen and not that of California State University, Sacramento. [as required in PM BA 96-13 Policy on CSUSInfo World Wide Web] |