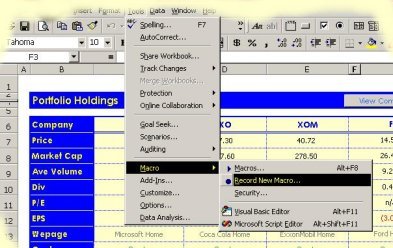
Financial Data
This sheet includes the
various companies, their ticker and associated financial information. The
info included is up to you but should include: recent price, P/E Ratio,
Dividend, EPS, Market Cap, Average Volume, Industry, and Homepage.
You find the information from the web (Yahoo, Fool, MoneyCentral, etc) and
insert the relevant and CORRECT information here.
Data
Sheet
The Data Sheet provides
the model with two functions. First, this sheet collects the raw data and
finds the monthly returns for each company. Using the closing prices and
any dividends paid out you assemble the returns and can discover any
number of things: How the company moves in relation to other stocks, or
the market. Or, it can be graphed showing the stock's history or its
trend.
The second function of
the Data Sheet is to provide a means of isolating the specific stocks that
are included in the portfolio. For instance, if there are 5 stocks in the
portfolio, then those specific 5 stocks (and their returns) are selected.
Once these returns are isolated, you can use Statistics (Covariance) to
determine how these stocks interact and relate to each other.
This sheet is the first
one which links data from other sheets and builds formulas that use data
from other sheets. For instance, the stocks from the portfolio are found
on the Client Sheet. To enter them on the data sheet, simply choose what cell
you
want to place them, and type :
= and then click <Client> Tab, and then ticker for the first company, and press
<Enter>. Moving to the right one cell, repeat for the second
company, etc.

Top
Matrix Sheet
This is where the model
gets interesting! The matrix sheet brings the information from the data
sheet and manipulates it using matrix algebra to derive various matrices.
Huh?
Remember that the data sheet isolates
the selected companies and their returns. Next you find the covariances
between Stocks A, B, C, D, and E. As shown:
| Cov (AA) |
Cov (AB) |
Cov ( AC) |
Cov (AD) |
Cov (AE) |
| Cov (BA) |
Cov (BB) |
Cov (BC) |
Cov (BD) |
Cov (BE) |
| Cov (CA) |
Cov (CB) |
Cov (CC) |
Cov (CD) |
Cov (CE) |
| Cov (DA) |
Cov (DB) |
Cov (DC) |
Cov (DD) |
Cov (DE) |
| Cov (EA) |
Cov (EB) |
Cov (EC) |
Cov (ED) |
Cov (EE) |
With the resulting information,
you develop a system that allows the user to create any number of
hypothetical portfolios and displays the level of risk for each possible
one.
Equity Sheet
This sheet will determine
what proportions of the selected stocks will make up an ALL-EQUITY (no
Bonds) portfolio. This sheet separates into two sections: All-Equity - no
constraint, and All-Equity with Constraint.
The graph made up of the
various returns in this Bond Sheet and the Standard Deviation (risk) creates
the Efficient Frontier. Of course there would be two Frontiers> One has
no constraint, and a lower one w/ constraint.
Top
Bond&Equity Sheet
This sheet determines the
proportions of various assets of a portfolio that includes both Equity and
Bonds. Similar to the Equity sheet there are two sections (w/ Constraint,
and w/o Constraint). An added element on this sheet is the finding of the
slope. The slopes allow you to find the maximum slope. This represents the
minimum variance portfolio. Or the portfolio along the frontier with the
lowest risk.
Along with the Bond
Sheet, this sheet determines the proportions used within the portfolio. As
a result is the heart of the model.
Client Sheet
This is the "Client
Interface". This sheet contains the various options that can be
changed such as what assets, constraints, returns, etc desired. At a
minimum, this sheet will show what assets make up the portfolio, the rate
of return, and proportions. However much additional information you
include is up to you, your design, and client needs.
Top
History Sheet
This sheet shows each
company's history, information, and financial results. For each company,
create a snapshot regarding what the company does, and how it is doing. As
a result, the client can check more detailed info regarding the various
companies in the portfolio.
Top