| Sacramento Forecast Project | Sacramento Region Economic Forecast | California State University, Sacramento |
| revised January, 2009 | ||
| Unemployment Rate | Fountain Predictor | Taxable Sales | Building Permits | Data Tables | Resources | SFP Page | ||
| The Sacramento Region is the combination of six counties (El Dorado, Placer, Sacramento, Sutter, Yolo and Yuba) or 2 MSA's (Sacramento and Yuba City). It is also the geographic area covered by the Sacramento Area Council of Governments (SACOG). |
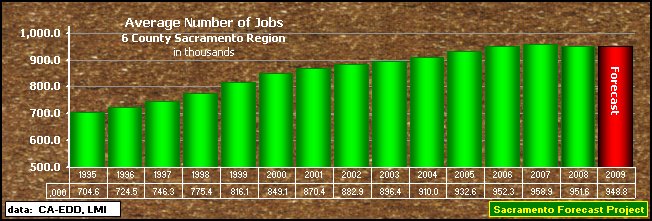
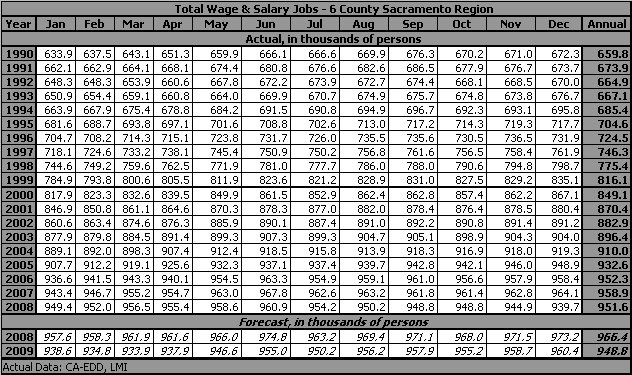
| Wage and Salary Jobs |
| 31Jan09: Job growth had been slow since the turn of the century (4.05% in 2000 was the fastest) in the six county Sacramento Region and had not had a decline in the number of Wage and Salary jobs since 1992. That is until the most recent annual result was a -0.7% (-7.3 thousand job) decrease in 2008. The forecast for 2009, based on actual data through December, 2008, is for a similar but smaller -0.3% (2.8 thousand job) decrease. |
|

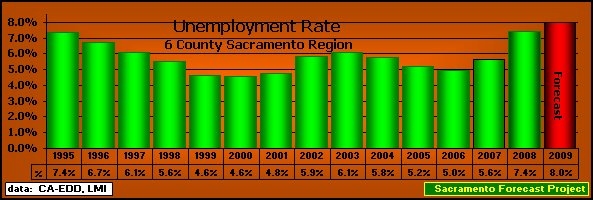
| Unemployment Rate |
| 31Jan09: The annual average Unemployment Rate for the Sacramento (6 County) Region in 2008 was 7.4%, up from the 5.6% in 2007. The Sacramento Region's annual Unemployment Rate, based on actual data through December, 2008, is forecast to be up to 8.0% in 2009. |
 |
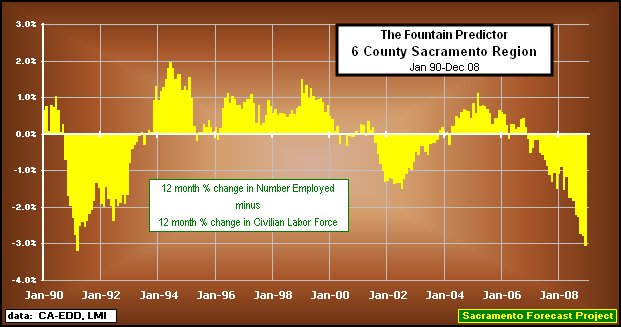
Fountain Predictor |
|
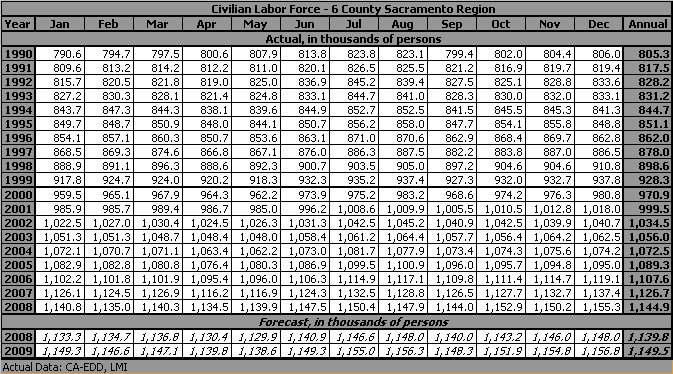
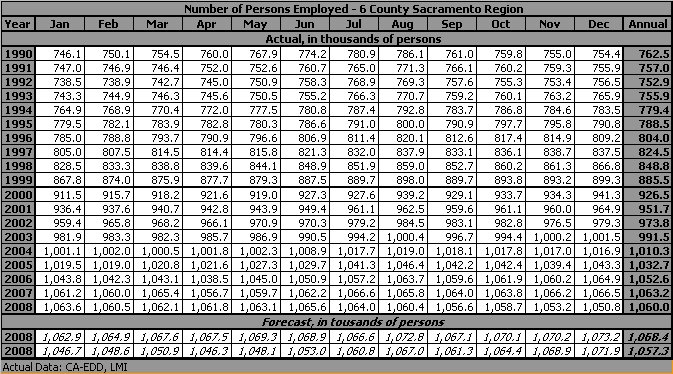
| 31Jan09: The Fountain Predictor turned negative in December, 2006 and has stayed in the red through December,2008. The general pattern (following the patterns in the constituent MSA's and counties) has been an increasing negative difference, with the December value of -3.05% - the largest of the cycle so far; larger than any of the negatives in the previous negative cycle (2002-03) and the largest since 1991. The negative difference is the result of the Labor Force increasing (+1.58%) while the Number of Persons Employed decreased (-1.47%). | |
 |
|
| The Fountain Predictor was named for Robert J. Fountain (Professor Emeritus, California State University, Sacramento) who suggested graphically comparing the twelve month percentage change in the Number of Persons Employed with the twelve month percentage change in the Civilian Labor Force as a measure the economic health of an area. | The theory suggests that as long as the percentage change in the Number of Persons Employed is larger than (above) the percentage change in the Civilian Labor Force, for that area, that area is in good economic health. |
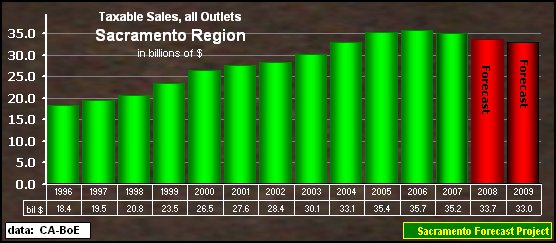
| Taxable Sales |
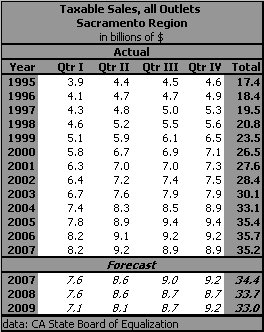
| 31Jan09: Taxable Sales for all outlets in the Sacramento Region amounted to over $35.2 billion in 2007, a decline of 1.6% from the $35.7 billion in sales in 2006. The forecast for 2008, based on reported results through the 4th quarter of 2007, is for a larger decline of 4.3% ($1.5 billion). The forecast for 2009 is for a smaller 1.9% decrease to $33.0 billion). |
 |
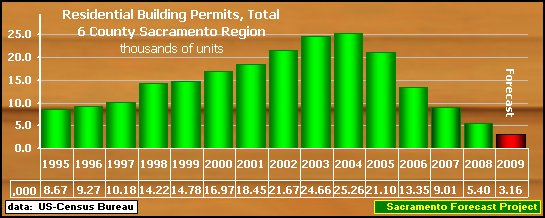
| Building Permits |
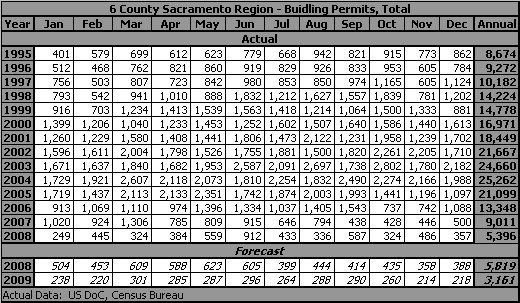
| 31Jan09: Residential construction, as measured by building permits, in the six county Sacramento Region has had some memorable moments of the last 10 years: the 40% surge in 1998, a 15% jump in 2000, a 17% jump in 2002 and a 14% increase in 2003. The 2.6% increase in 2004 was the top, with the year ending with permits for more than 25,000 new units. The number of permits declined by 16.5% in 2005, with just shy of 20,900 permits issued; declined again by 36.7%, with only 13,350 permits issued in 2006, declined again 32.5% in 2007, with only 9,010 permits issued and, most recently declined 40.1% to 5,400 permits in 2008. The forecast for 2009, based on actual data through December, 2008, is for a 41.4% decline to 3,160 permits issued for the year. |
 |
| Data Tables | ||
| The Sacramento Forecast Project maintains files for these variables and the supporting variables for the Sacramento Region, in Excel format, that can be made available on request. | ||
 |
||
 |
||
 |
||
 |
||
 |
||
| Resources | ||
For information on the Sacramento Region.
Data Providers: |
||
|
Back to Sacramento Forecast Project Update: January, 2009 Next Revision: July, 2009 URL: http://www.csus.edu/indiv/j/jensena/sfp/srri/sac-reg.htm Arthur N. Jensen, Emeritus Professor of Marketing e-mail to: a.jensen@comcast.net California State University, Sacramento Disclaimer: Professor Arthur N. Jensen takes full responsibility for the information posted. The information on this page represents that of Professor Arthur N. Jensen and not that of California State University, Sacramento. [as required in PM BA 96-13 Policy on CSUSInfo World Wide Web] |